From the macro to the micro, CardioLog Analytics’ content grouping and content drill-down tools offer intelligent, interactive and new ways of looking at your data.
- Easily compare the performance of different parts of your intranet portal
- Conduct rich reporting on any sub-section of your site, down to individual documents
- Use our flexible tools with SharePoint 2013
- Gain complete control over who has access to your reports
CardioLog Analytics automatically categorizes individual pages according to the site map of your intranet portal. It’s easy to see the value and logic of this approach. Because it is based on the site structure, content drill down enables you to get interactive reports in which you can drill deep into a specific section or subsection of your site – all the way down to the level of single pages and documents. In addition, content grouping enables you to automatically select various pages or parts of your site and treat them as one unit. This allows you to see how each page in a content group is being used and – more importantly – the influence of each page in the group in convincing your users to continue clicking to the next page.
Our incredibly powerful and flexible tools allow you to see, at a glance, which content is performing well, and what is letting you down. Content grouping and content drilldown can show you the various sections of your portal that attract the most users – as well as the pages and documents that no one is looking at. By allowing for easy comparison of the performance of different parts of your portal, CardioLog Analytics helps you to look at the bigger picture – and then, when you uncover problems, to dig deeper into the details.
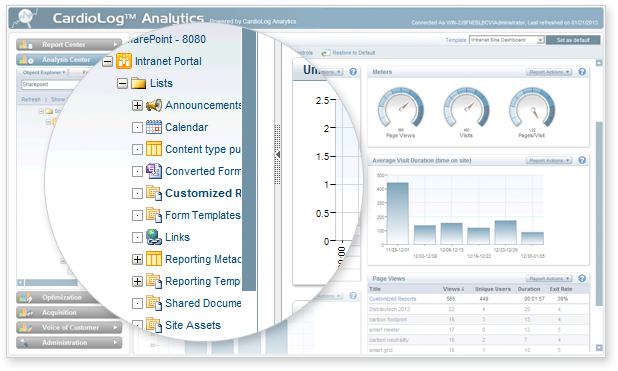
CardioLog Analytics allows for a thorough content drill down because it works through a website tree – Object Explorer – that maps out the entire structure and content of your site and is automatically enabled through various adaptors. This enables you to analyze the usage of your subsites, subdirectories, single pages, documents, or any other level of your portal’s hierarchy. The information offers you a more meaningful look at how well your organization is performing through a wealth of in-depth, interactive reporting options. You can click on any part of Object Explorer to view a real-time analysis of that part of your portal, and there is a search box to help you find any specific subsite, page or document you want to analyze. With CardioLog Analytics, you can expect content drilldown that provides richly detailed reporting on the usage of your portal.
The flexibility that content drill down offers is particularly important when it comes to the new version of Microsoft’s SharePoint – SharePoint 2013 – which provides a new way of creating navigation bars for your portal, instead of relying on traditional navigation that’s based on the site structure. The new managed-navigation feature allows for an entirely flexible display, enabling you to design site navigation based on concepts that are important for your organization. CardioLog Analytics caters to this new conception of site navigation, taking the new, flexible structure into account by creating automatic content groups and using them as independent report entities.
It’s also possible to customize your content grouping and content drill down with CardioLog Analytics. In addition to automatic content grouping, you can also tailor your groups – simply adding and removing any items you wish, through Object Explorer – to hone in on the details you want. A report can include any combination of items from your portal and treat them as a content group, offering you complete flexibility and control over your data. And, in terms of customized drill down, CardioLog automatically generates the hierarchical structure for SharePoint-based portals, but you can also create custom content drill down for a site that isn’t based on SharePoint, using our custom tree web service.
In addition to providing an easy way to aggregate your reporting data, Object Explorer also allows you to determine which of your employees and partners have access to your various reports, at any level of the website tree, to make sure the right people see the right data.
>>API