SharePoint & Microsoft Office 365 Insights Just in the Nick of Time
Want real-time data about your SharePoint and Microsoft Office 365 usage that you can analyze and then act upon immediately? Look no farther, CardioLog Analytics has got you covered. The “Object Explorer” feature within the CardioLog Analysis center allows you to map out the entire content and structure of your portal through an intuitive portal tree. You can click on any part of the portal tree to view real-time analysis of the specific part of the portal that you’re inquiring about.
The Analysis center also provides a search box that assists you in finding any specific sub-site, page or document you would like to analyze. You can create and save new analysis reports based on widgets of your choice or existing analysis templates.
CardioLog Analytics provides very specified roles and permissions within the Analysis center, so a user assigned with an Analyst role can view real-time data for any monitored page.
No longer will you have to jump through leaps and bounds to understand the specific, real-time status of a specific page or subpage in your portal. CardioLog Analytics is optimized to assist you in tracking any aspect of your portal, whenever, and wherever you would like.
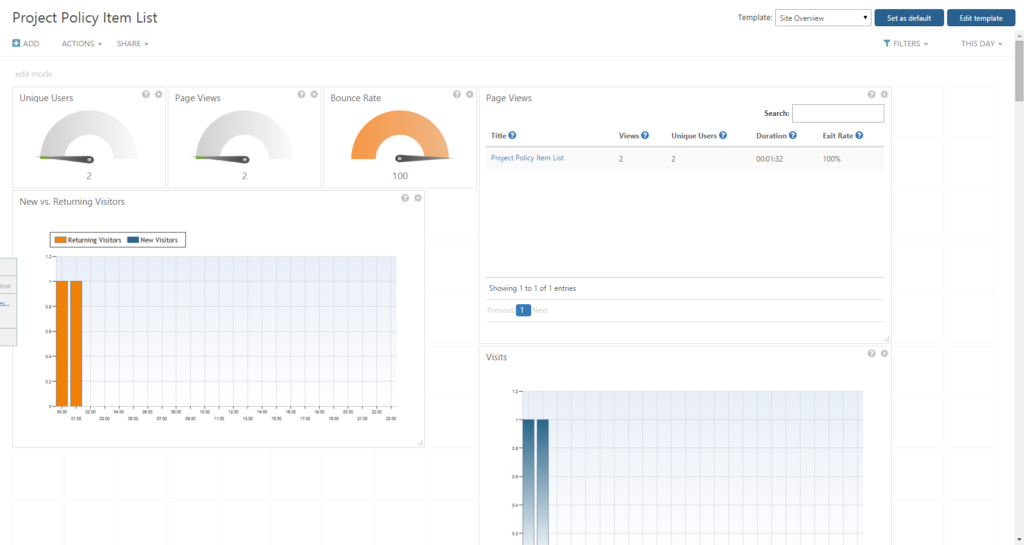
Real time data for a selected item in Object Explorer
Next >> Javascript Tracking Tool