
The ultimate goal for setting up analytics is to understand user behavior on your website. This can be the single most influential factor that will increase conversions (if that is your ultimate goal).
Having a target enables you to map out exactly what needs to be changed and how you can apply those changes.
This is what heatmap analytics is for. Take time to identify what and how to track key factors that can supercharge your website’s performance.
What is Heatmap Analysis?
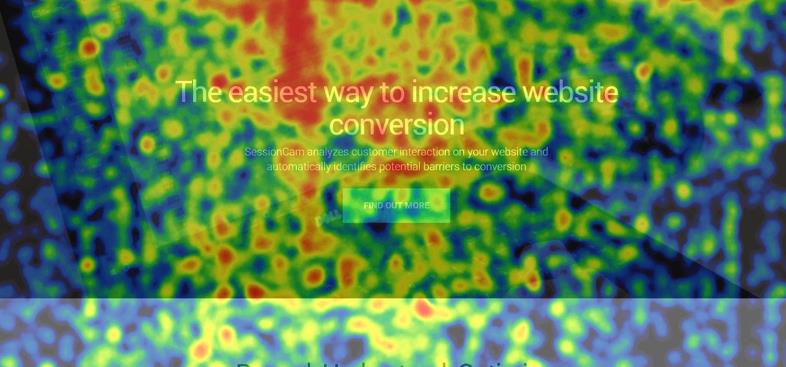
The simplest definition for a heatmap analysis is to identify how users interact with your page. It is like your spy vision goggles that let you gain crucial data that you would otherwise miss.
It is a visual representation of how your visitors behave on your website. With heatmap analysis, you will be able to see what pages they are interacting with and for how long. You can also determine what links they click on and any other actions they perform.
Heatmaps are one of the best innovations when it comes to the UX design approach. It enables you to pinpoint usability issues, understand effectiveness of CTA buttons, and other triggers that will encourage user navigation (so they spend more time on your website).
There are several heat mapping tools available that will collect vital data for your website. Some are free but most are paid. The type of tool you choose will determine the extent of data that you can gather and analyze. If you want a more extensive look at your website performance, you can go for the paid tools.

What Does a Heatmap Tell You?
A heatmap analysis can provide several crucial data that you can analyze later. You can take note of these data below and their corresponding value to your website performance so you can determine where improvements can be made.
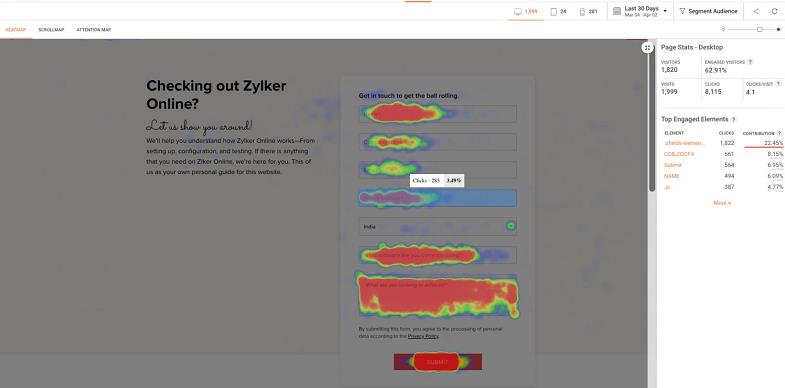
- Clicks – This is the most well-known heatmap data. This will show you where in your page your visitors are clicking on. The most important data you can get from this is what makes your visitors click on those links and navigational cues.
- Scroll – This is a visual representation of the visitors’ scroll depth on your page. This will give you a good indication of how far visitors scroll through their page before they leave or explore other pages.
- Engagement – This data will show you how users engage with the page. It is a good indicator of how users consume the content on your page.
- Eye Tracking – This is a more advanced area for analysis as it shows the eye movement of users on your page. It is important because you can identify the elements with highest fixation points and how you can improve that.
How to Translate Heatmap Analytics into Action Points
Heat mapping is only the first step towards improving your website design. This tool allows you to take a more in-depth approach towards identifying what areas of your website to change or update, if you want higher engagement and conversion.
Using the data collected from the heatmap analytics, you can use it as a guide to build a set of action plans that will help create a better, more functional website. The following are action points you can take in order to improve conversion and overall success rate.
Are people seeing the most valuable content/information on your page?
This is the most important step you can take to improve your website using heatmap analytics. Use this data to determine the ideal placement for the most valuable content on your website.
Using the heatmap data, you can review the position of the average fold – or the spot on your website that users focus their attention on prior to navigating your website. Identifying the average fold will help you maximize that placement so you can highlight the most important content on your homepage.
If you do not place your most valuable content within the average fold, you lose the opportunity to showcase that information to your audience. You will have to wait for them to scroll down the page or explore other areas of the page to see it.
If you have other important inner pages on your website, you can also use the heatmap to determine if your website visitors actually make it to that page (or pages). In most cases, you use the home page as a way to guide your visitors to do further navigation into your website as those inner pages contain more information. Do visitors get to see these pages?
This can be highly valuable as it could mean one of few things:
- You are not providing adequate stimuli for them to navigate to those other pages.
- They cannot figure out how to navigate your website.
- The call to action to visit inner pages is not visible in the average fold line.
Are they responding to your Call to Action (CTA)?
Your website’s CTA buttons are one of the most important elements on your web page. Is it doing its job of converting your visitors?
Heatmap analytics can provide the answer to that. But once you have the data, what do you do to achieve the action you want from your audience?
First, define what your call to action is. Do you want your visitors to buy a product? Or sign up to your newsletter? Do you want to generate more business inquiries?
Once you have defined your goal for the CTA, you can use the data from the heatmap analysis to make appropriate changes to compel these actions.
One of the reasons why a lot of website visitors do not respond to the CTA buttons is because they overlap with the non-clickable elements on your website. Therefore, you need to make your CTA buttons highly visible. Aside from the visually compelling buttons, the position of the buttons is also a crucial factor. Have you maximized their position so they can be easily seen?
Do you have too many elements on your page?
Less is more. This is mostly true with web design and especially in terms of UX design.
When there are too many elements on one page, it can distract your visitors from the most important action you want them to make. Look at the heatmap data. Is the user’s cursor activity all over the place? If this is the case, it can indicate that there is a lack of focus and direction when it comes to the placement of your page elements.
Boost interaction on the most important elements by evaluating their position properly and designing your buttons to make them compelling.
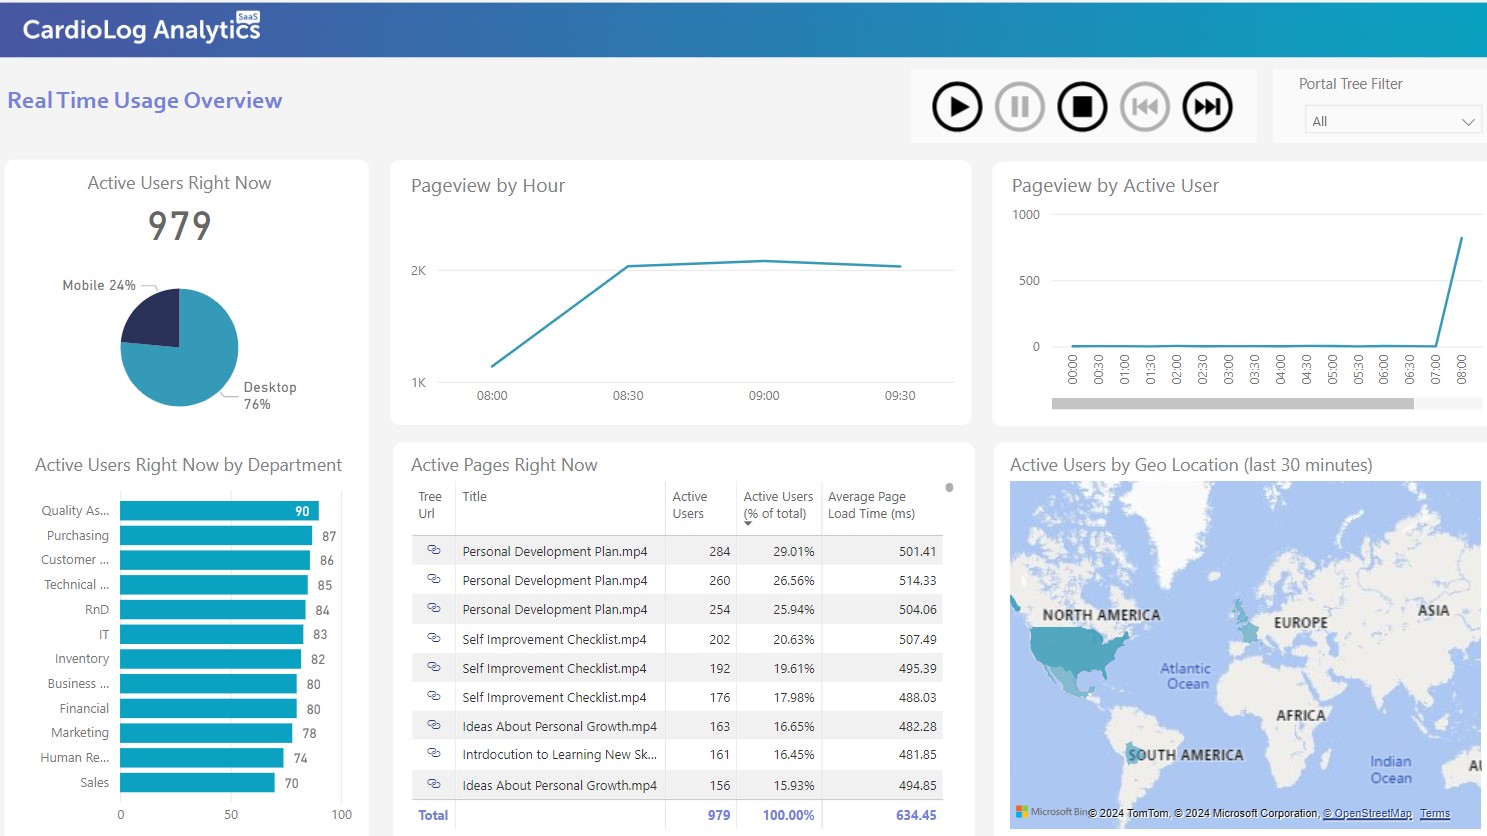
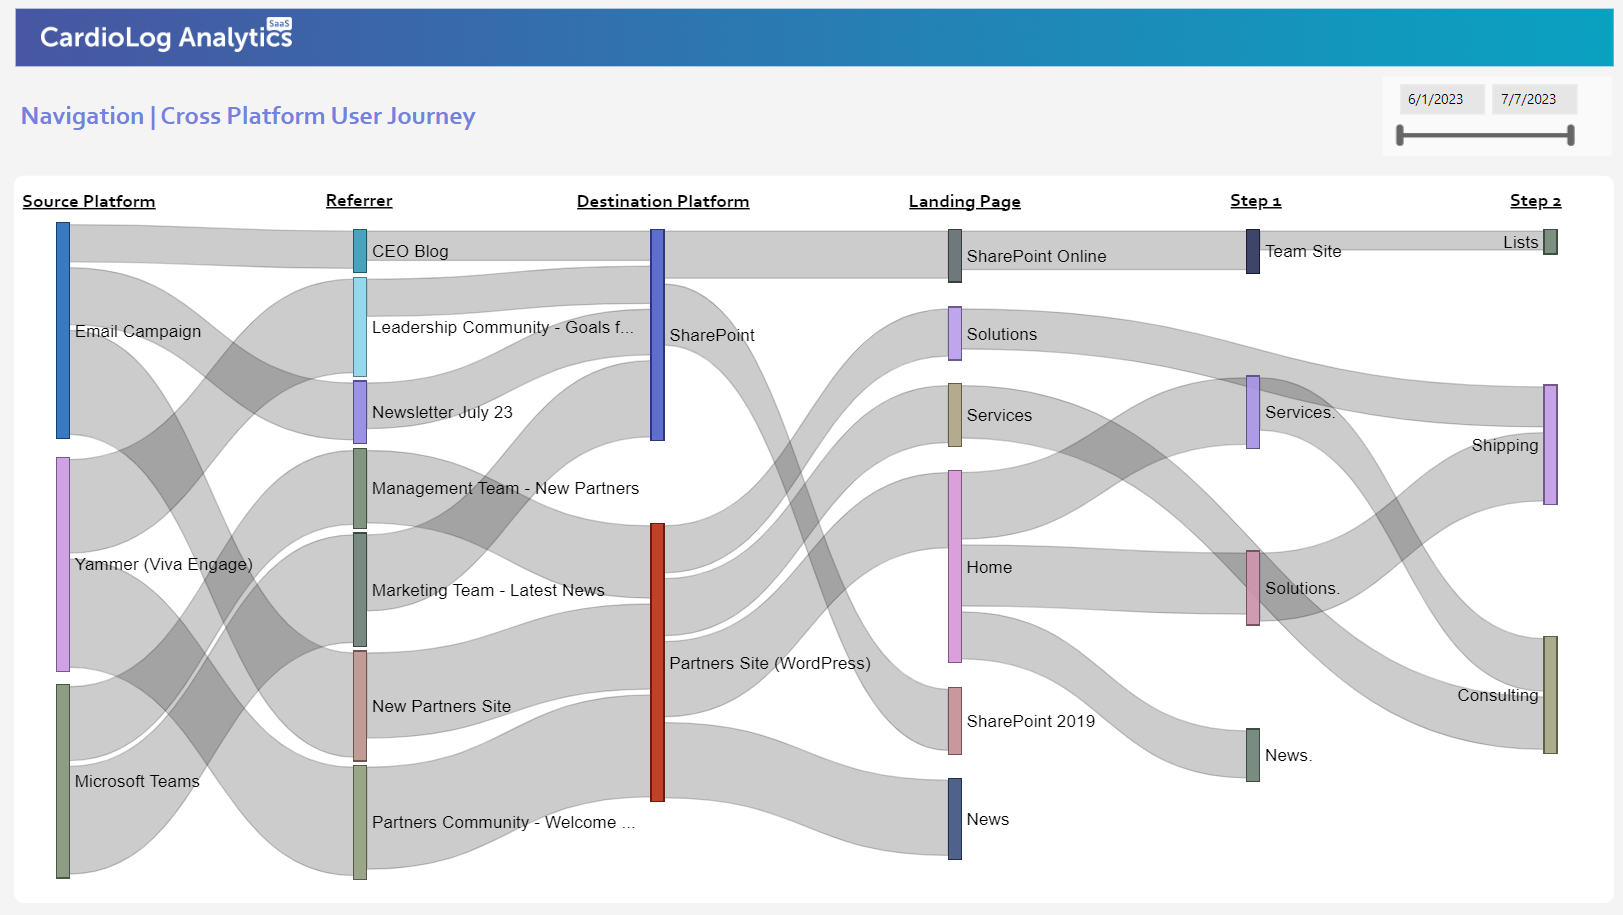
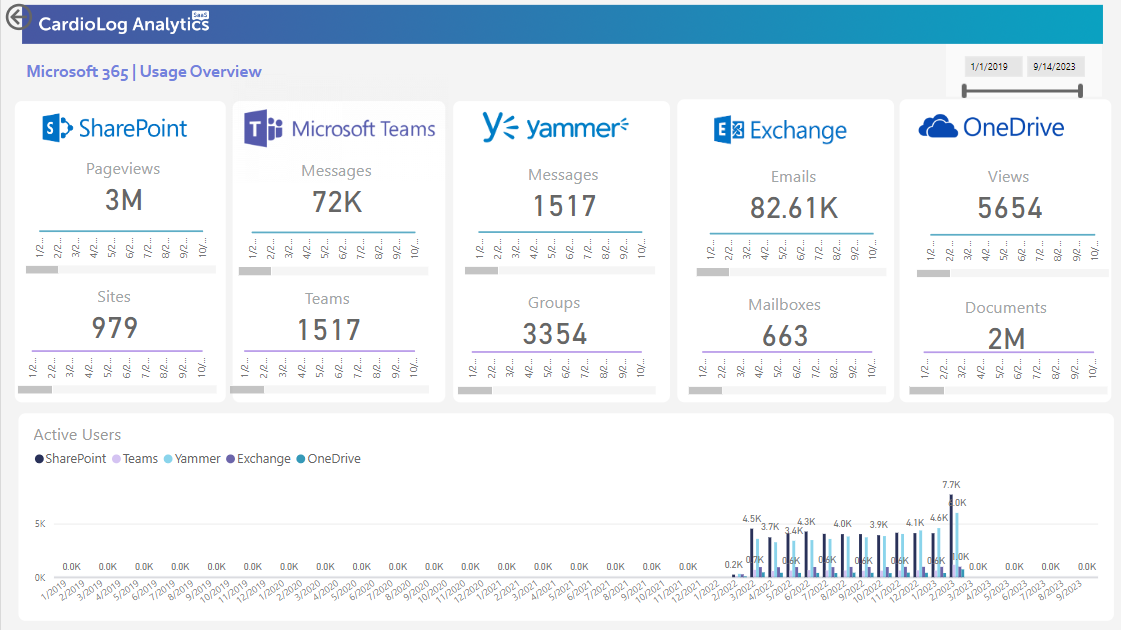
Heatmap analytics is a vital step you can take to ensure that you are optimizing website performance. Generating insights from various data sources remains a big challenge for most businesses. Augmented Analytics pinpoints problematic areas on the web or SharePoint page so you can take action based on the data.


 Follow @cardiolog