The Future of AI-Driven
Visualized Data Analytics
Drive SharePoint Adoption and User Productivity with NexGen SaaS-based Data Analytics Maps and Insights
Features
Flexible
Deployment
Options
Fast and effortless process

Designed for
SharePoint &
Microsoft 365
Adding more layers
to give more value

Instantly Analyze
Your SharePoint
Data in the Cloud
Real-time
analytics reports

How it works
Generating insights from data remains a huge challenge for almost all businesses. Augmented Analytics pinpoints problematic areas on the SharePoint page so you can take action based on the data.
Visualizing the tracked data in different formats helps with easier interpretation and analysis
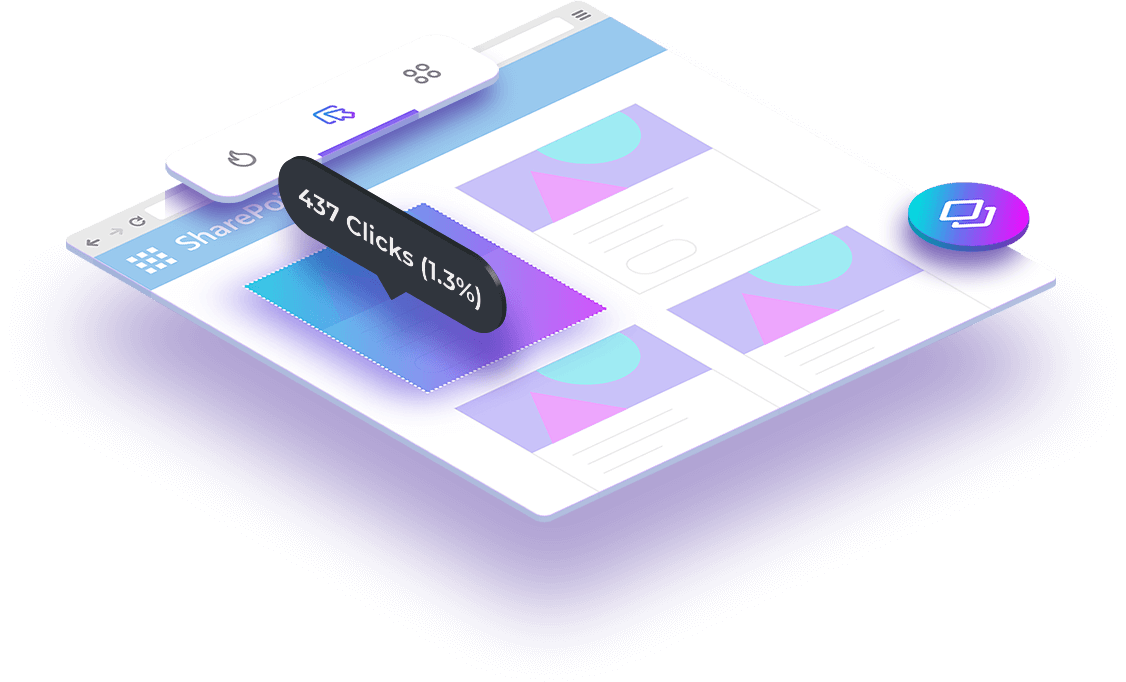
Click Map
Show what content on a page users mostly clicked on.
Understand where your visitors are clicking within a particular page as well as the flow of clicks within the page which helps content owners track on-page user engagement, such as clicks on buttons, links, images to truly understand what does and doesn't entice users' interactions.
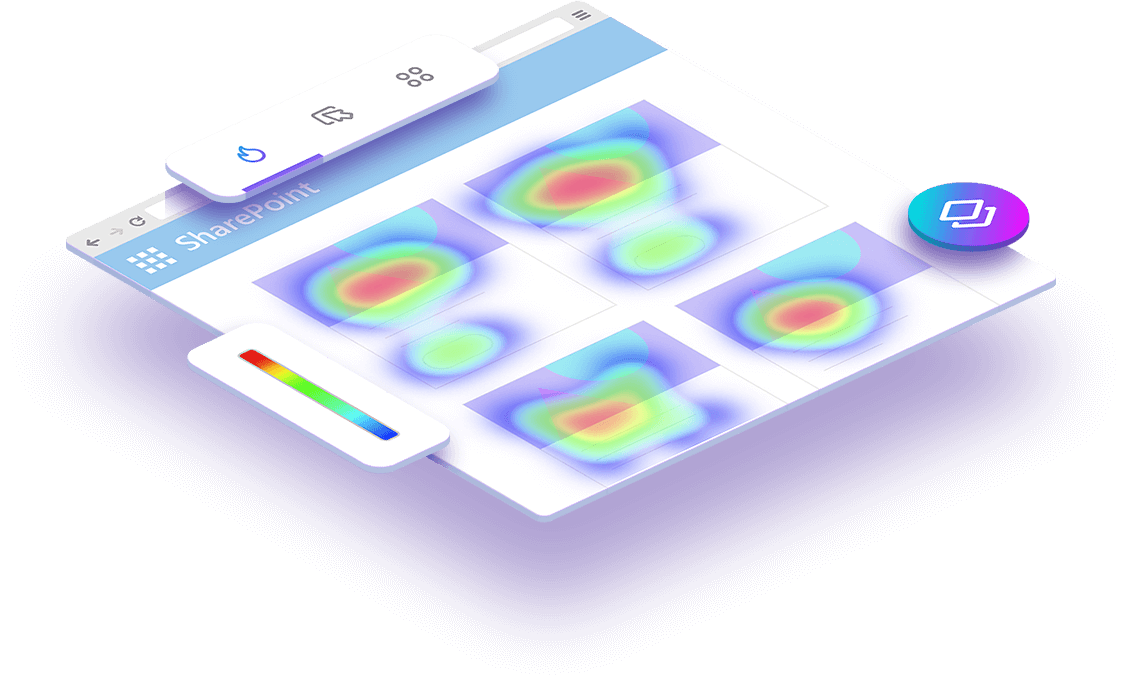
Heat Map
Heat maps aggregate all mouse activity to show which content was consumed the most
Knowing what content is being consumed the most and what content is being ignored helps to truly understand the highest relevancy of content and what content can be moved, deleted or achieved.
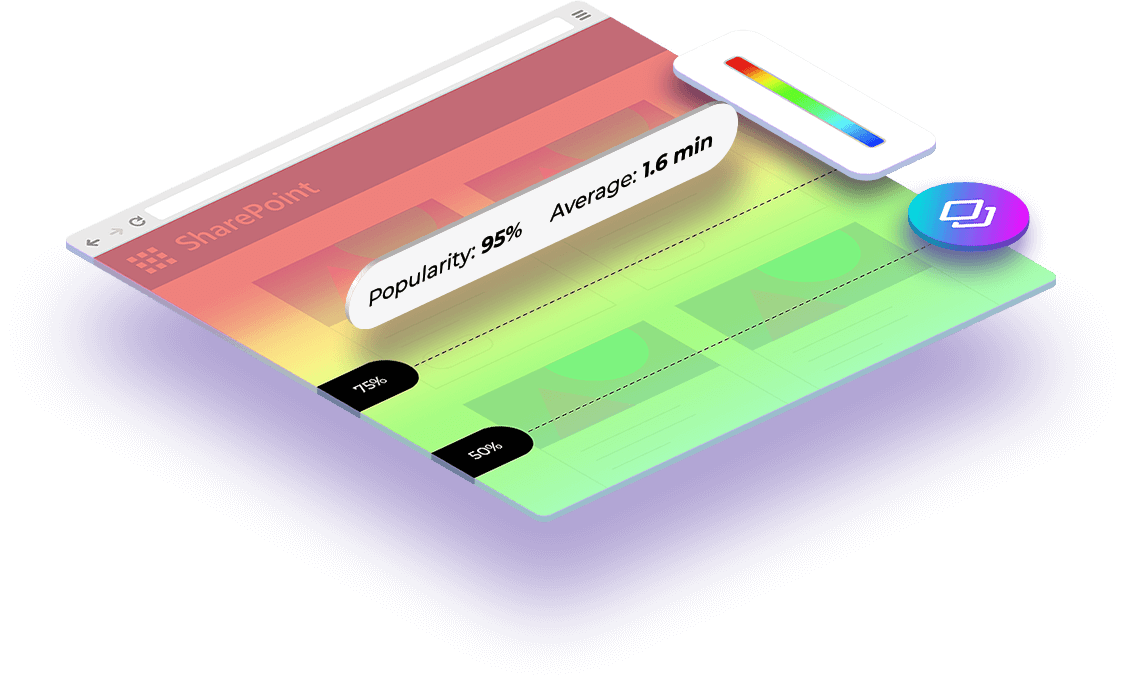
Scroll Map
The scroll map shows the page exposure level for every item on the page by showing how far down people scroll on the page.
With this information you'll be able to make sure relevant content, links, and calls to action are seen by the vast majority of your visitors, and avoid a lot of content being missed by visitors simply due to the position on the page.
AI-Driven Analytics
and Actionable Insights
Augmented Analytics uses AI and machine learning techniques to present to business people the insights most important to them. It uses innovative processes to automate data analysis and speed up the process of analyzing data, while simultaneously minimizing errors, maximizing data accuracy, and ultimately improving the efficiency of analyzing data.
Using AI-Driven Analytics we help your data analysts and decision-makers by transforming, extracting, loading, and providing clean and high-quality data presented by Augmented Analytics. These automated insights are actionable because it connects directly to an action that can be taken to solve a problem on the platform.
These actionable insights are extremely helpful because they serve as a guiding light for what should be prioritized on the platform to help drive business productivity.
Augmented Analytics’ meaningful insights take you step by step to improve your site or content and transform how analytics can be consumed.
Recommendations make it easy to take action based on the insights. Augmented Analytics’ insights make it easy for organizations to know what content is redundant and how space on the page can be utilized better.
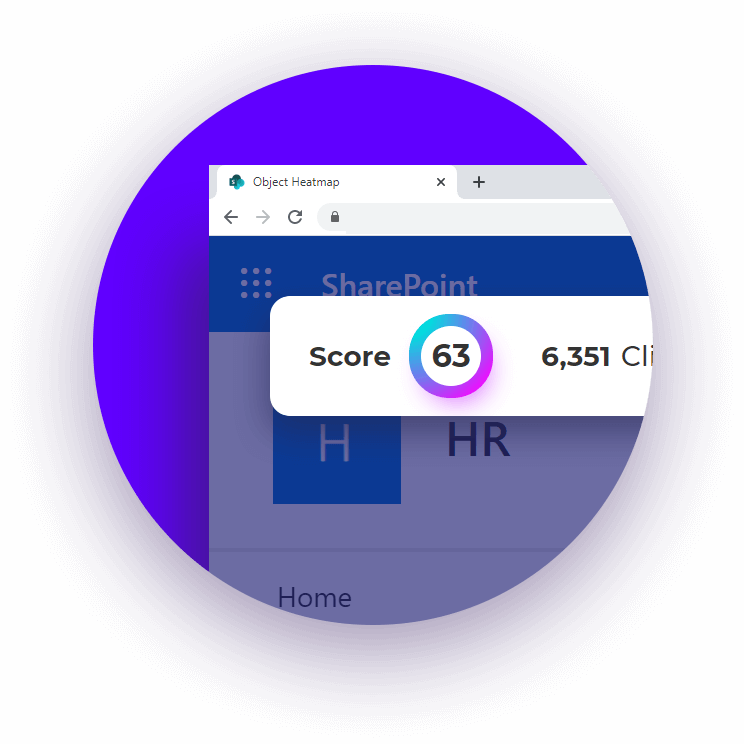
Competition
& motivation
Our sophisticated analytics engine tracks activity on the page and transforms it into points, giving each page a score. This score helps to visualize usability and progress and creates healthy competition and motivates site owners and content writers to make the digital workplace more efficient and productive for users.
Advanced
Data filtering
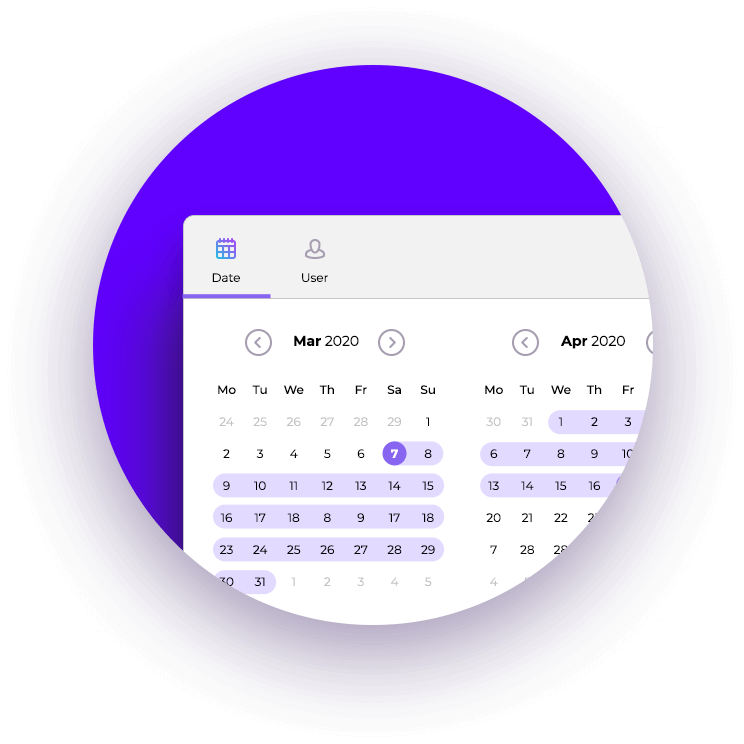
✓ By date range
✓ By user department, geography & location
✓ By specific user