Click Map
Click tracking gives you a clear visualization of users’ journey in the SharePoint portal, and helps you make the changes to your pages and user experience, which will improve that path in the future
Click Map
Click Maps are great reports to use so you can easily visualize traffic, conversion and success metrics within the pages of your SharePoint portal. Click maps provide a detailed record of your SharePoint users journey. Utilizing click maps can provide a better analysis of how your SharePoint site’s elements are performing so you can make the necessary changes or improvements. By offering detailed click maps CardioLog Analytics has taken SharePoint Analytics to a whole new level of accuracy and in-depth analysis, providing the most comprehensive understanding of the user journey on SharePoint pages. By using cutting edge click tracking technology, you add a new dimension of recording and analyzing user activity that cannot be matched by a heat map.
What is a click map?
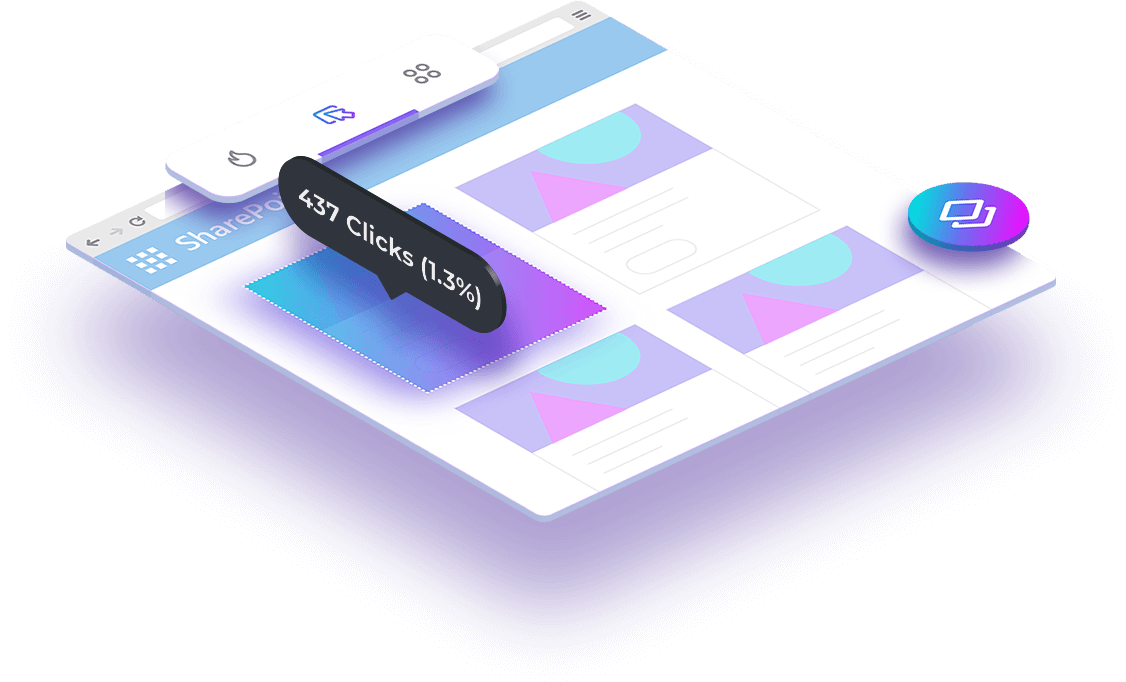
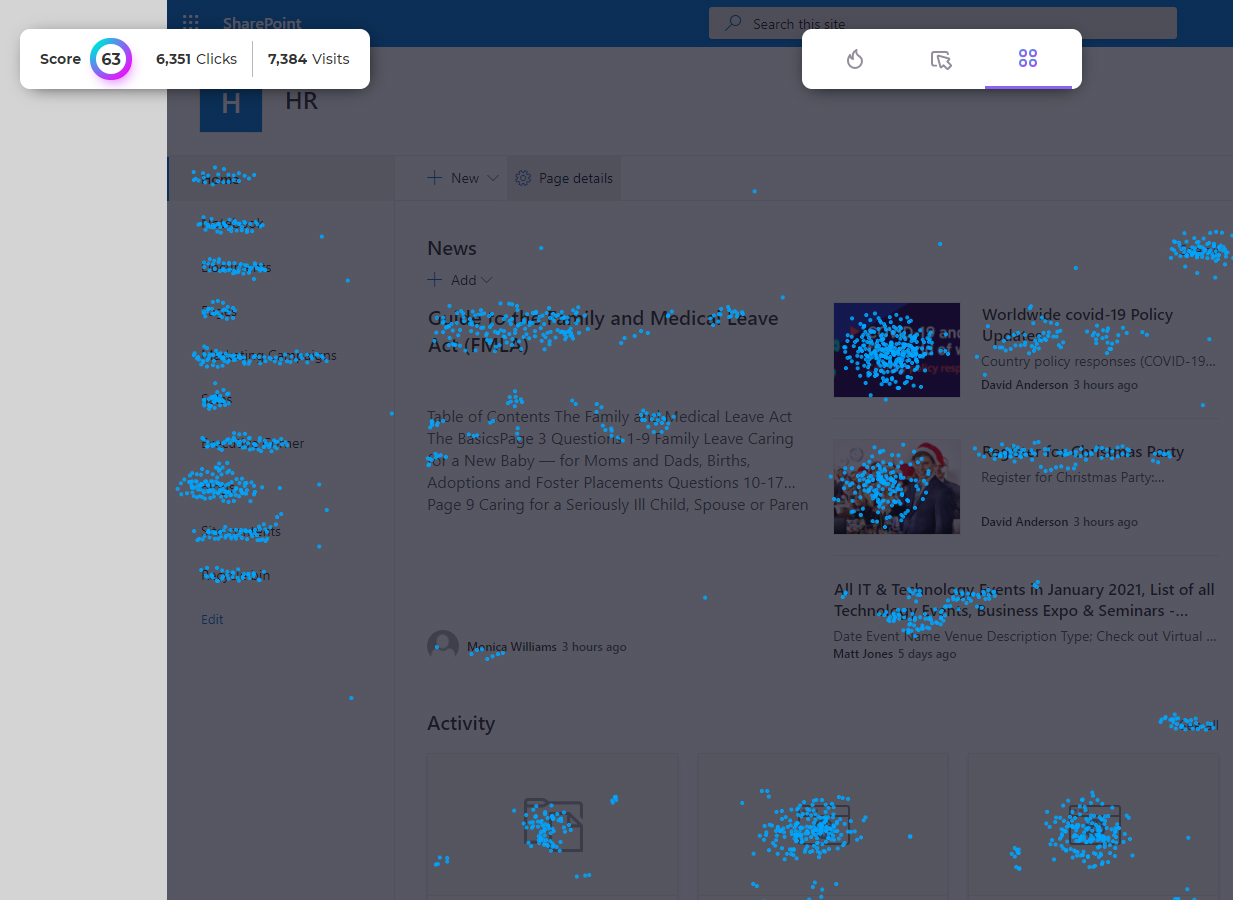
A click map is a report that can be created to show how individuals click on links within individual pages of the SharePoint portal. These metrics are overlaid on top of the page’s links to answer critical questions. A click map allows you to see each and every click on a SharePoint page. It provides real-time data on how many times specific buttons, headers or images of your site are being clicked on, within any given time. This data can then be used to understand your user’s behavior and if what you are seeing within a specific session is part of a much wider problem experienced by other visitors.
How to
Use Click Maps
As well as establishing a clearer understanding of the user’s behavior, click tracking also provides an understanding as to the experience on the SharePoint site itself, including how users respond to and engage with each SharePoint page, where they click, tap, move and scroll, all of which is captured in real-time.
By creating a clip map, you can track your user activity in order to improve the design of your SharePoint pages, as well as gain a greater understanding of your users’ portal preferences and experiences. You can attain the unique ability to zero-in on which elements of the pages are successful, and which elements are not gaining much attention. A click map gives you intelligible insights so you can discover the obstacles that exist within your site.
By understanding these obstacles, you can then determine which links and images aren’t getting enough clicks, and which call to action buttons are being ignored. If you notice a certain location on the page is drawing attention to the user’s eye, place your buttons there.
Click Map Insights
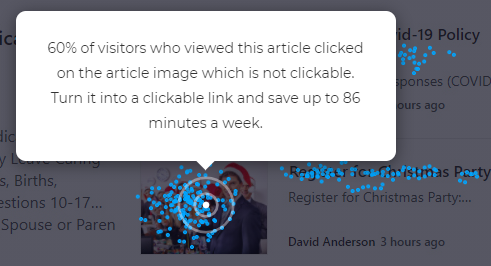
Beyond just the clicks, our Augmented Analytics also adds some actionable insights to those clicks, telling you in detail what actions can be taken to make it easier to get to that content which will help to improve your site or content and save a lot of time by doing so.
Using click maps will help you:
By taking click analytics to the next level, you can understand your visitors’ behavior and optimize your SharePoint site like never before.