

CardioLog Analytics only
Copilot activity, mapped to your content
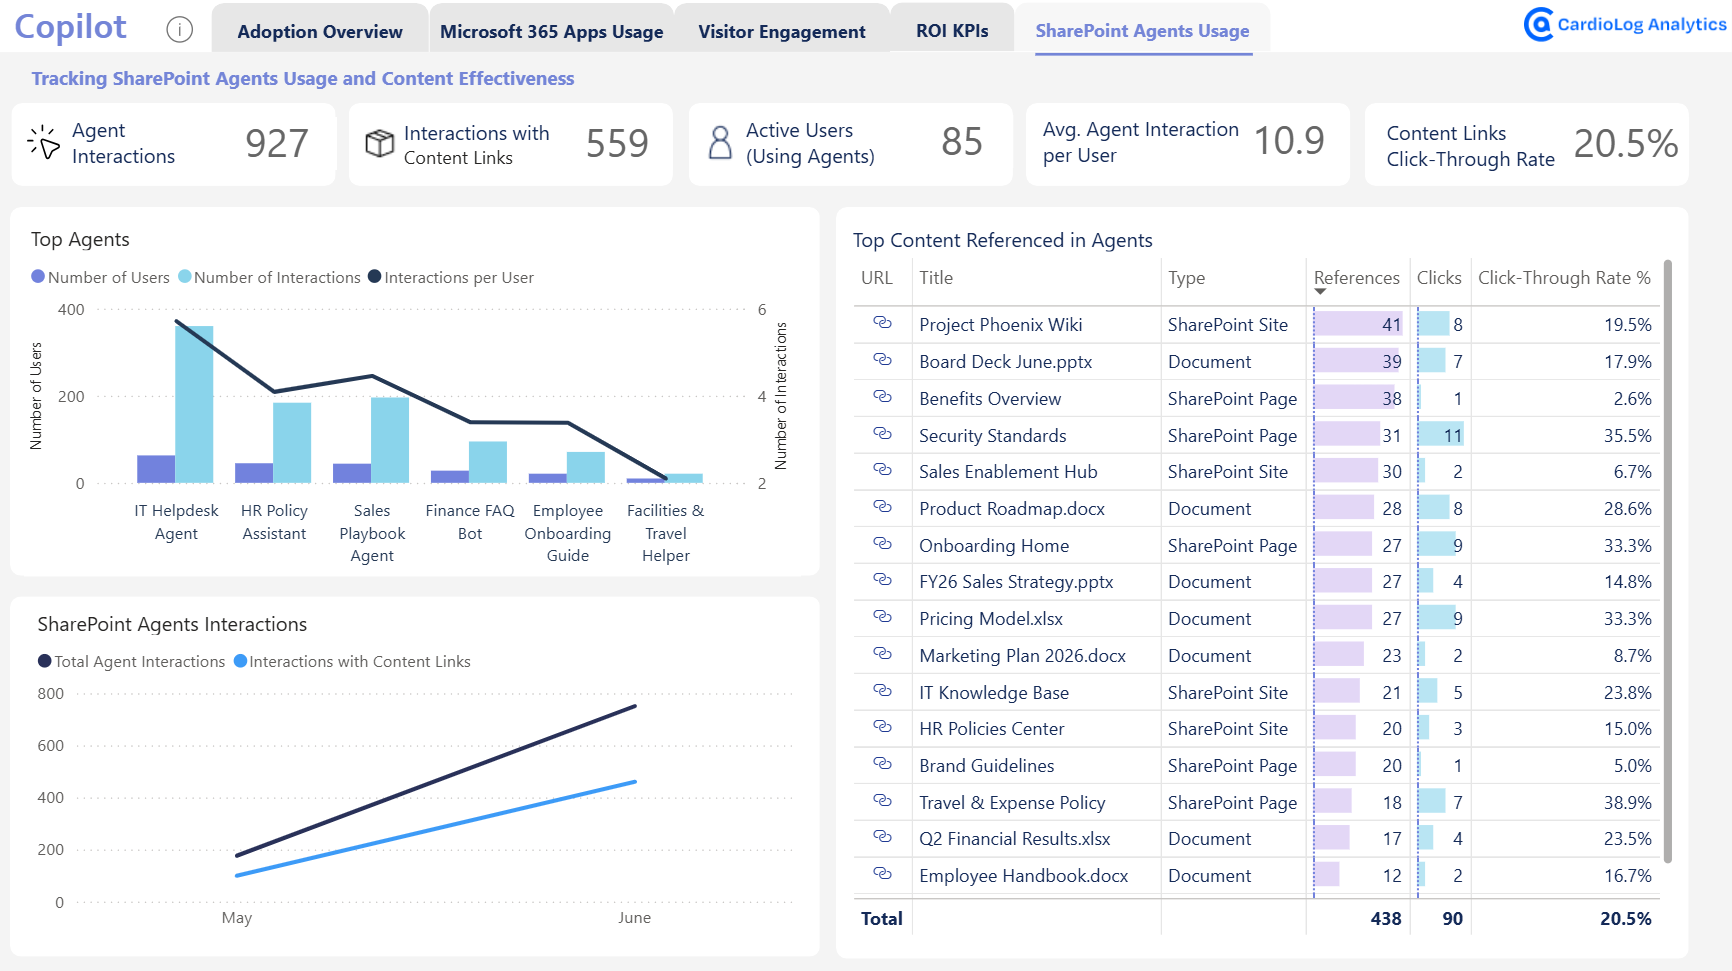
See Copilot readiness and usage against the specific sites, pages, libraries, and documents they touch, on the same content graph CardioLog Analytics already reports on for SharePoint and Microsoft 365.
Why it matters: you can finally answer “which content is driving (or blocking) Copilot value?”, not just “how many people used Copilot?”
CardioLog Analytics goes to |  Microsoft stops at Microsoft stops at |
|---|---|
| Copilot readiness, adoption, and usage resolved down to the individual content object. This is the intersection Microsoft’s tools don’t occupy. | User-, app-, and action-level counts. No Microsoft surface (not the admin center, and not Viva Insights' Copilot Dashboard or Advanced Reporting) ties Copilot activity to a specific file or page. |