
All sites in one place
Report across all your SharePoint sites and farms, and drill down to a single page or document.

See who uses SharePoint, which content they rely on and what they ignore, across every site. SharePoint Online, on-premises and hybrid.
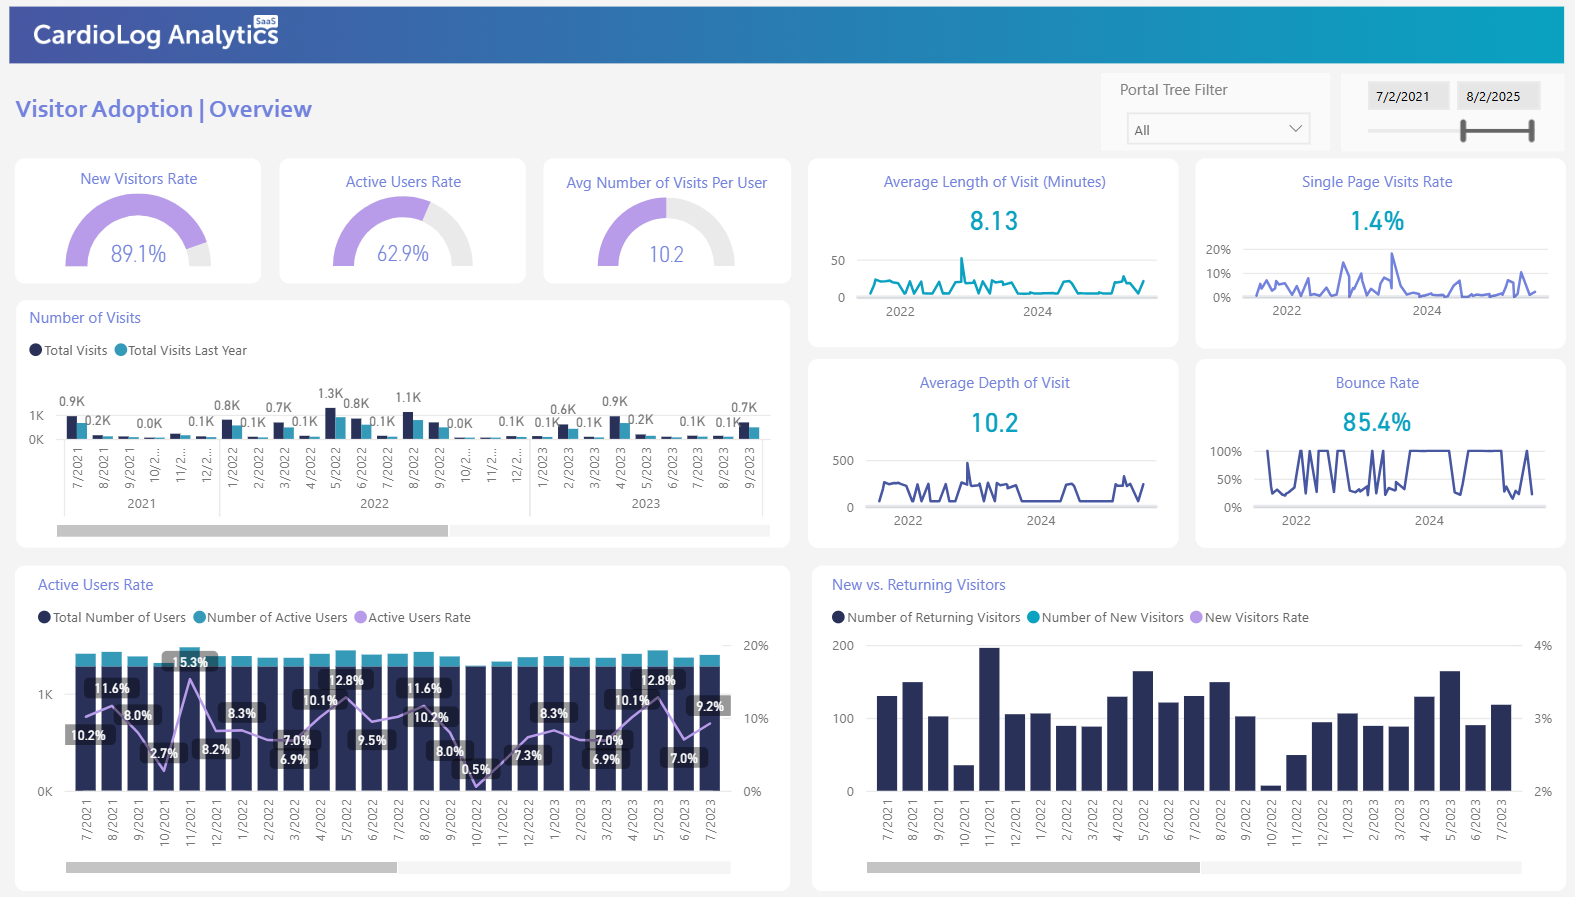







Know who is using your SharePoint intranet, how often, and when.
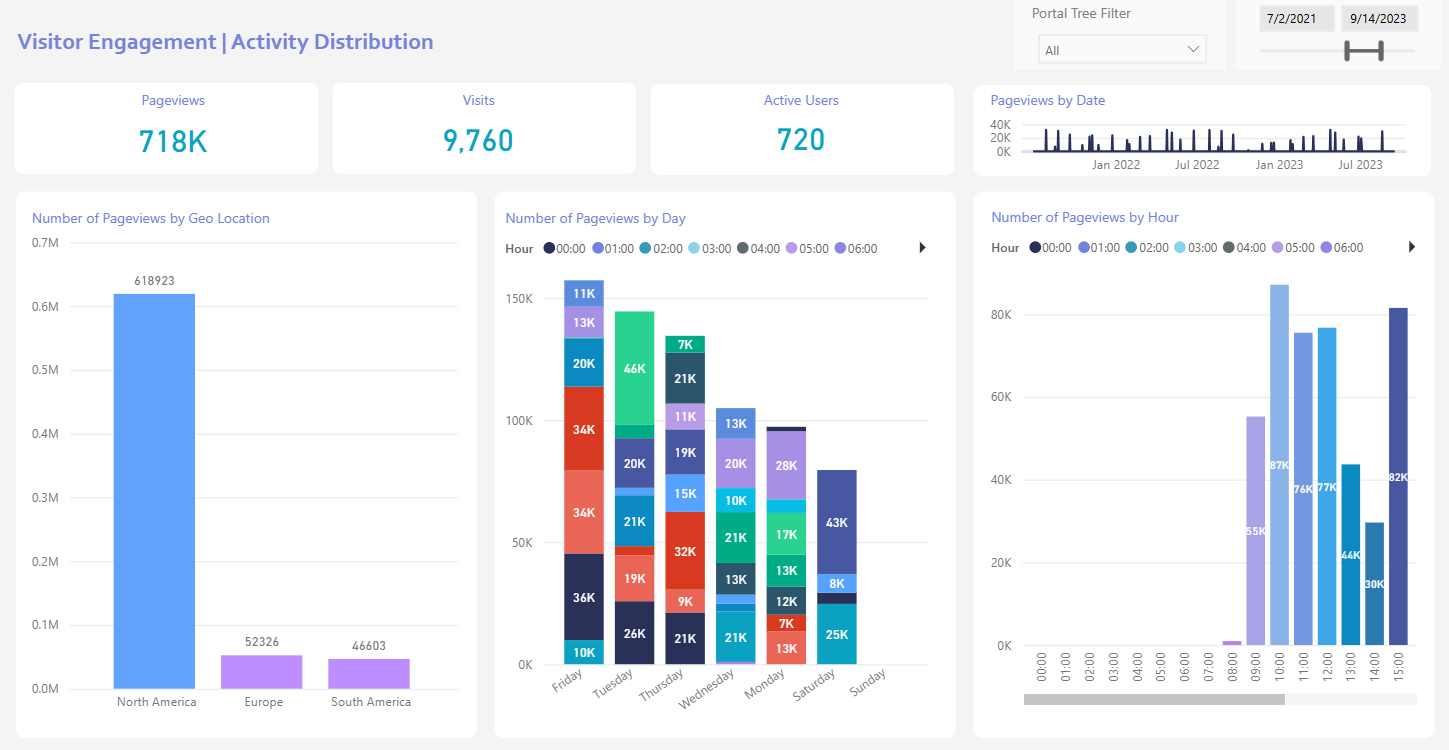
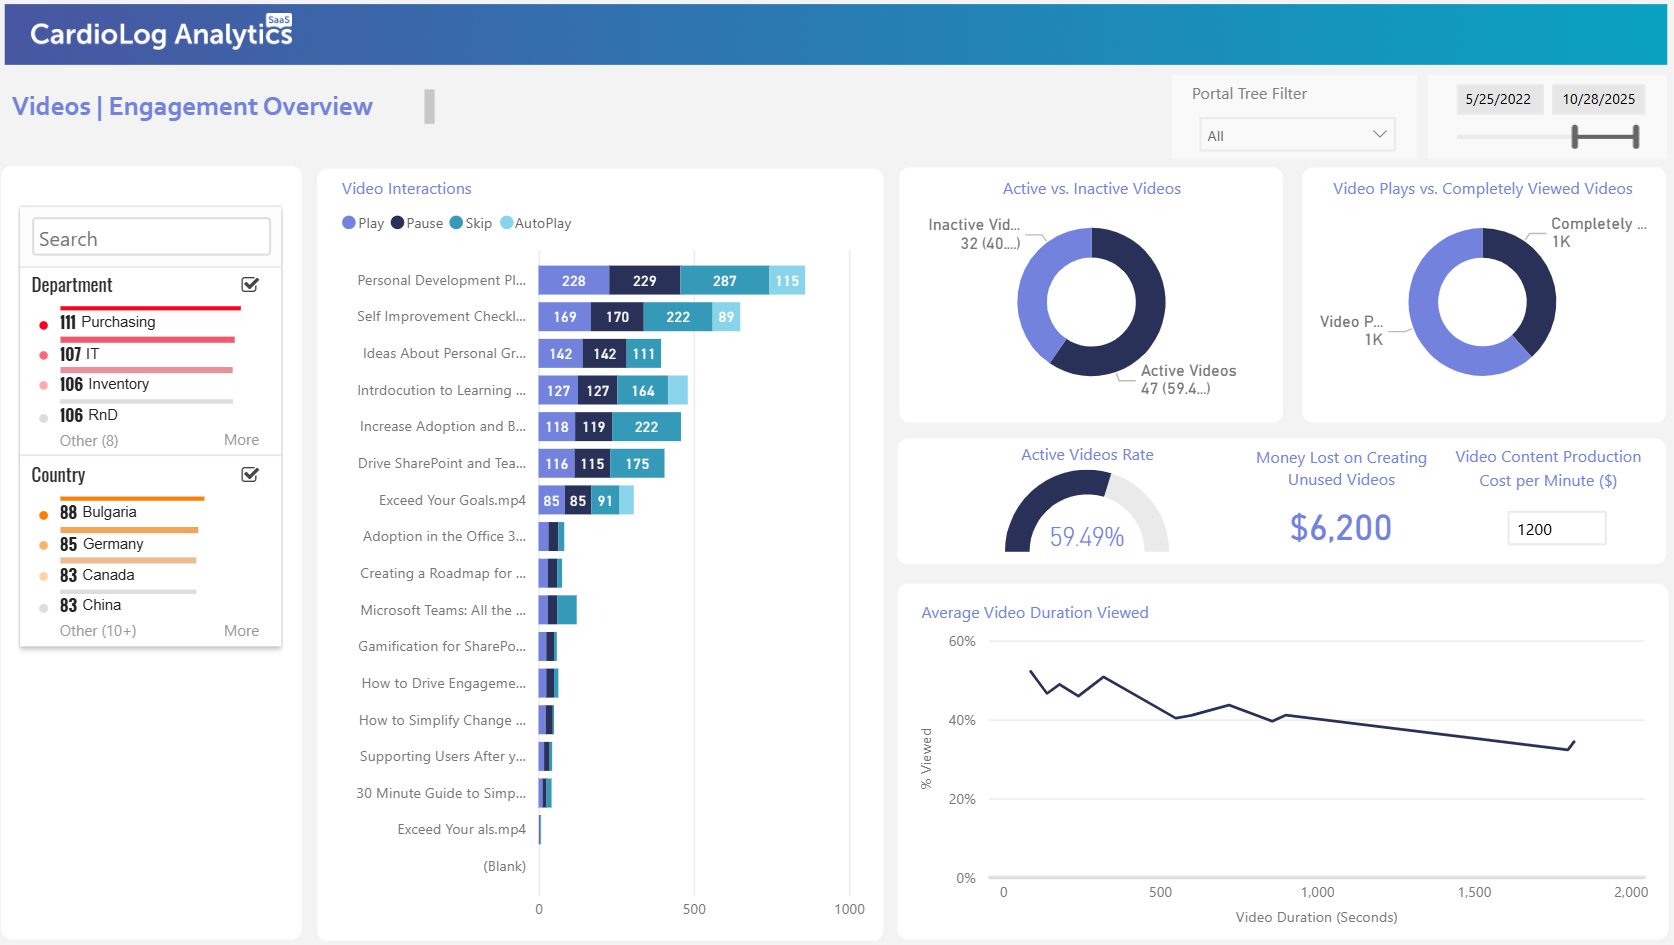
Find the pages, documents and videos people rely on, and the ones nobody opens.
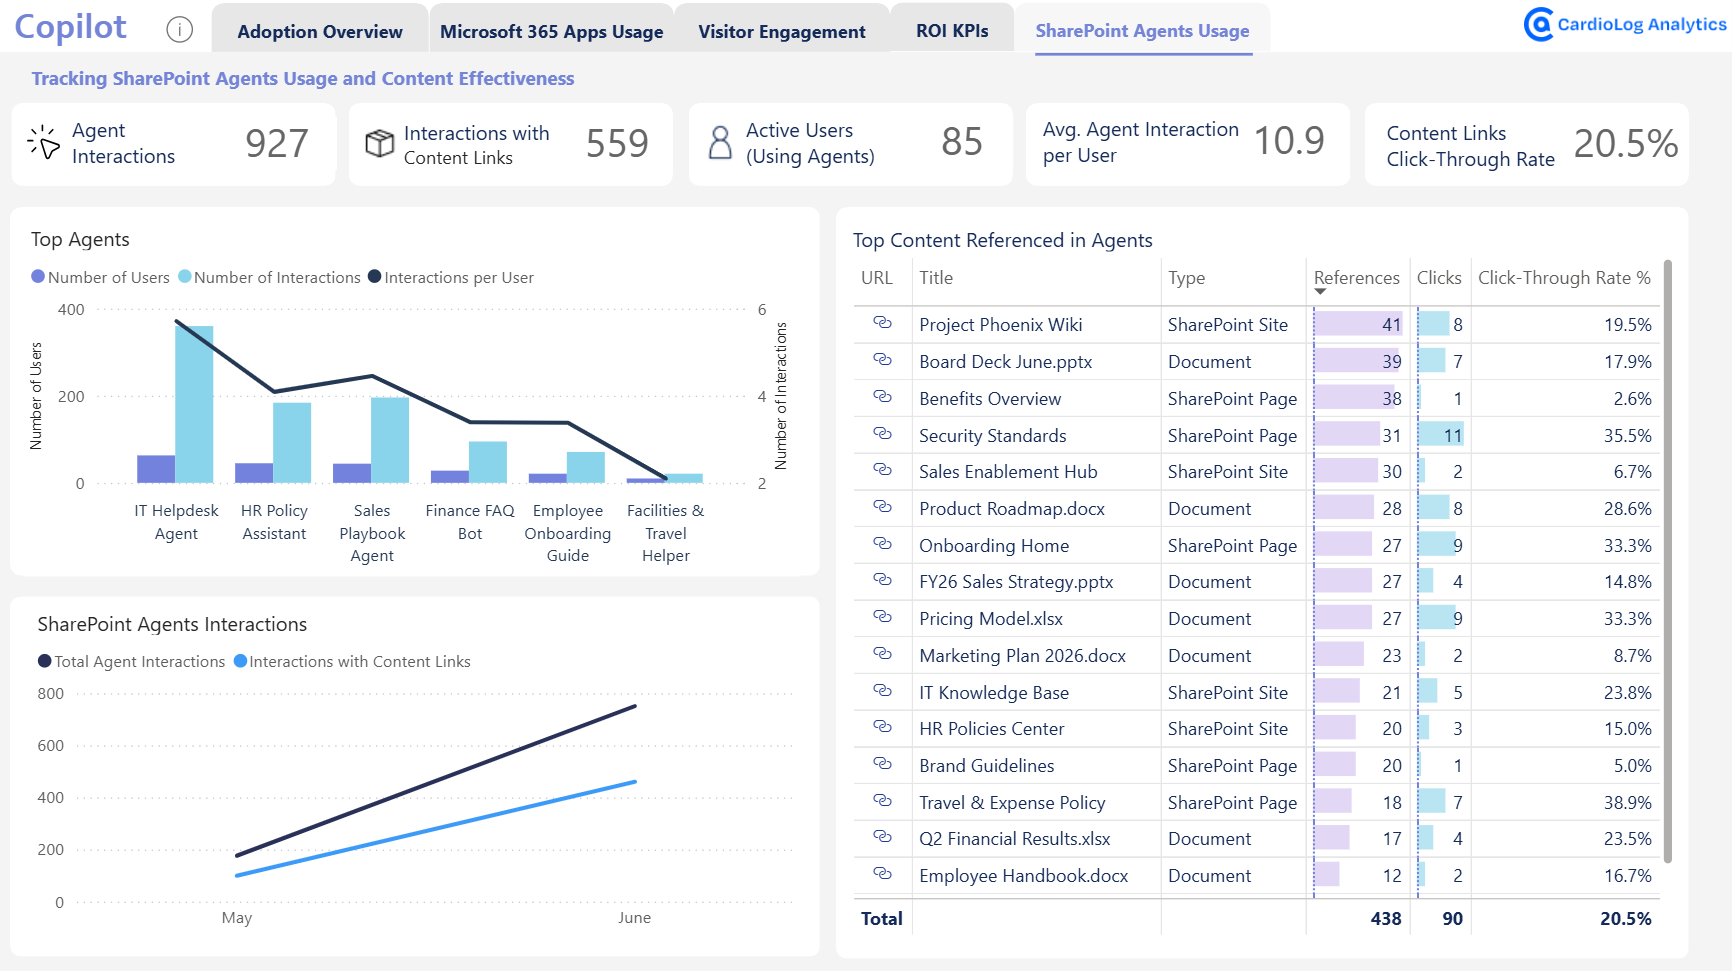
See how people use Copilot agents in SharePoint, and whether your content is helping them.
Report across all your SharePoint sites and farms, and drill down to a single page or document.
Filter any report by Active Directory or SharePoint user profile data, such as department or location.
Choose how long to keep data, even for deleted content. Native site usage reports cover up to 90 days.
SharePoint analytics is the tracking and reporting of how people use SharePoint: who visits, which content they view, what they search for and how they move through sites. It helps intranet teams improve adoption and content.
Yes, but it is basic. SharePoint site usage reports cover up to 90 days, and Microsoft 365 admin center reports up to 180 days, with limited filtering. CardioLog Analytics adds cross-site reporting, user segmentation, longer history and deeper content and search reports.
CardioLog Analytics shows which users viewed each page, document or video and when they last viewed it.
Yes. CardioLog Analytics supports SharePoint Online, SharePoint Subscription Edition and hybrid deployments.
Yes. CardioLog search reports show popular search terms, whether they return good results and which results people click, filtered by site or library.
Yes. CardioLog Analytics reports on SharePoint agent interactions, active users, top agents and which SharePoint content agents reference and users click.
Yes. CardioLog Analytics integrates with Power BI, and reports can also be exported to Excel, PowerPoint or PDF, embedded in SharePoint or sent by scheduled email.
The vendor site uses cookies and similar technologies. By using this site, you are agreeing to our revised Privacy Policy, including our arbitration terms and cookie policy.