

The dashboard looked impressive.
You have seen it before.
Traffic is up, page views are climbing, and leadership assumes things are working.
Then someone asks a simple question. What are people actually doing on the intranet?
That is where things break.
According to Microsoft, organizations using Microsoft 365 generate massive volumes of activity data across SharePoint, Teams, and OneDrive, yet most reporting remains limited to surface level metrics rather than behavioral insight.
You can see the scale here: https://learn.microsoft.com/en-us/microsoft-365/admin/activity-reports/activity-reports?view=o365-worldwide
Page views are easy to report.
They are also easy to misunderstand.
Why Page Views Became the Default KPI
Page views exist because they are available.
They are built into native SharePoint reporting, simple to extract, and easy to explain to non-technical stakeholders.
No modeling required. No interpretation needed. Just a number.
That convenience comes at a cost.
Most organizations end up treating page views as a proxy for engagement, adoption, and even productivity.
They are none of those things.
Here is what page views actually represent:
- A visit occurred
- A page loaded
- A user clicked or landed
That is it.
No indication of:
- Time spent
- Interaction depth
- Navigation intent
- Task completion
- Content effectiveness
So the KPI becomes misleading.
Quietly.
The Illusion of Engagement
High page views feel like success.
But in practice, they often mask deeper issues:
- Users land on a page and leave immediately
- Content is opened but not read
- Navigation paths break down halfway
- Search leads to dead ends
You get activity without engagement.
This is where most reporting fails.
Because page views inflate perception.
And perception drives decisions.
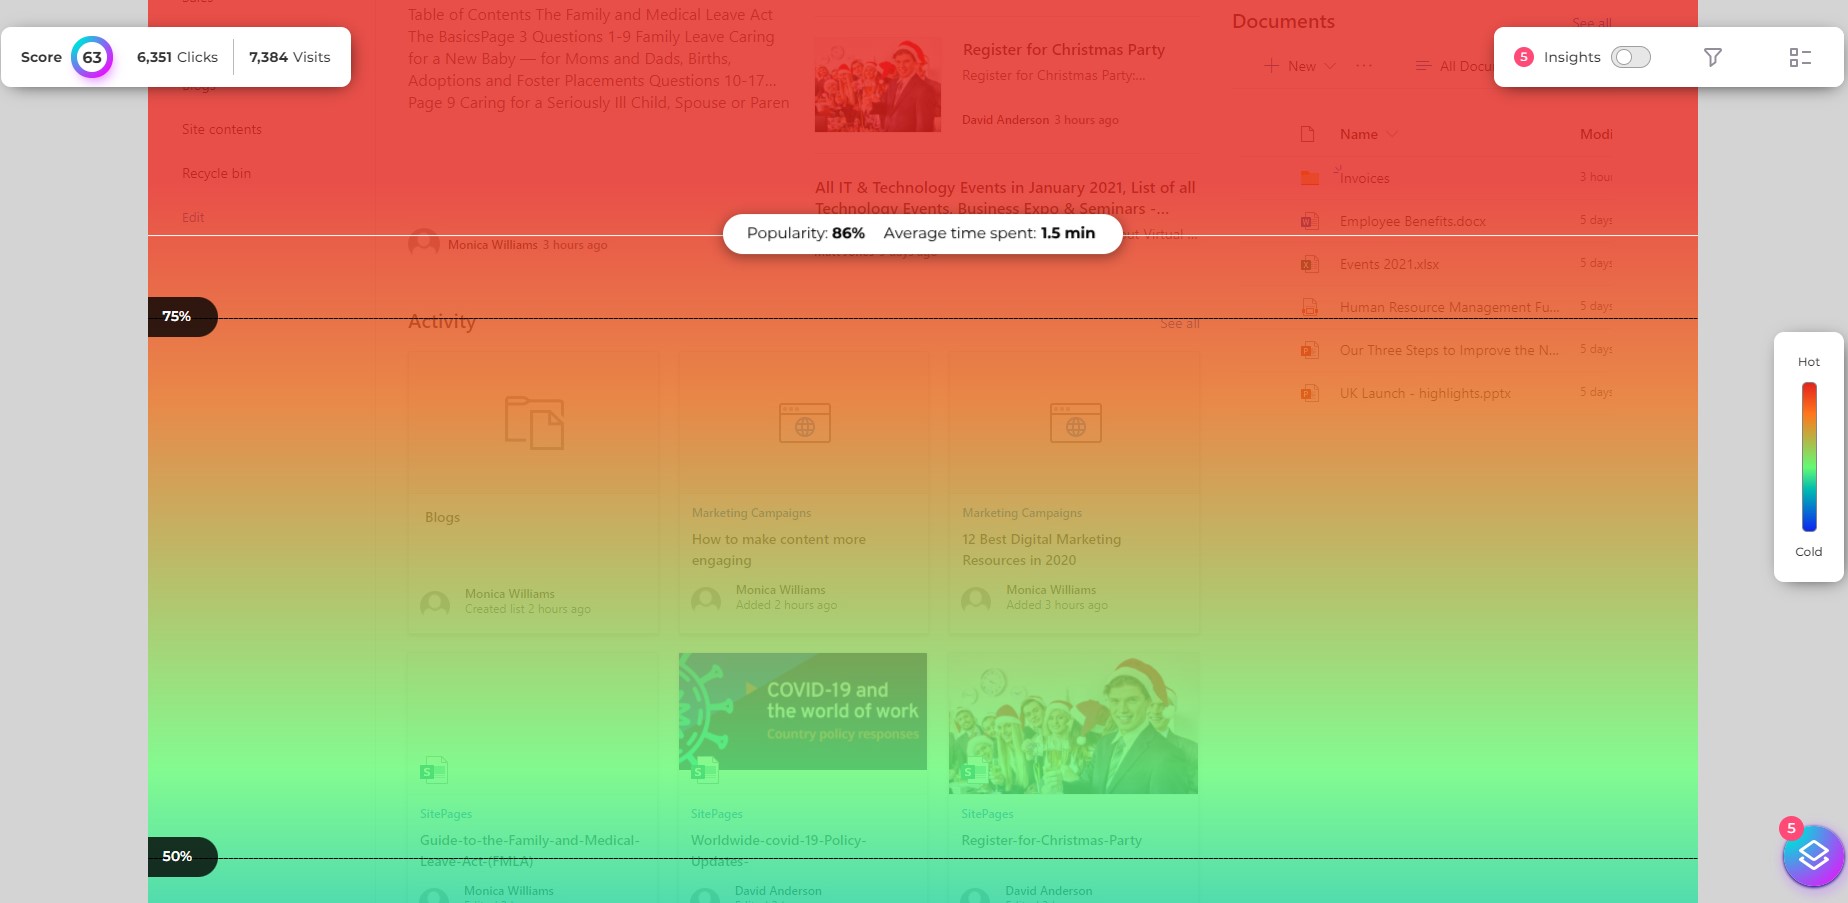
What Page Views Hide in Real Environment
In a recent customer environment, page views were rising steadily month over month.
Everything looked healthy.
Then we looked deeper.
- Over 60 percent of visits ended within seconds
- Key pages had no downstream navigation
- Internal search queries were repeated multiple times
- Users were not reaching critical content
It was not engagement.
It was friction.
This is common.
Why Native SharePoint Analytics Is Not Enough
Native Microsoft 365 reporting is designed for visibility, not diagnosis.
It answers basic questions:
- How many users visited a site
- How many pages were viewed
- Which documents were accessed
It does not answer:
- Where users hesitate
- Why they abandon
- How they navigate
- Whether content is effective
That gap matters.
Because operational decisions depend on it.
The Reporting Gap
Most teams rely on:
- Site usage reports
- Page popularity
- Basic activity dashboards
These are useful starting points.
But they stop short of behavioral understanding.
And that is where the real insight lives.
The Business Risk of Misleading KPIs
This is not just a reporting issue.
It is a business problem.
When page views drive decision making, organizations risk:
- Investing in underperforming content
- Missing signs of adoption fatigue
- Ignoring navigation entropy
- Misjudging intranet ROI
And the cost compounds.
Especially at scale.
Where It Shows Up First
You will typically see it in:
- Intranet redesign cycles that do not improve engagement
- Internal comms teams pushing more content without results
- Stakeholders questioning the value of SharePoint investments
- Leadership asking for ROI clarity and not getting it
That last one. It comes fast.
What Engagement Actually Looks Like
Engagement is behavioral.
It reflects what users do after they land on a page.
Not just that they arrived.
Real engagement signals include:
- Time spent per page
- Scroll depth
- Click paths
- Navigation flow
- Search refinement behavior
- Drop off points
These are measurable.
But not with page views alone.
The Shift in Measurement
High performing organizations are moving toward:
- Journey based analytics
- Task completion tracking
- Content effectiveness metrics
- Tenant level visibility across workloads
This changes everything.
Because it moves reporting from activity to outcomes.
Where SharePoint Analytics Need to Evolve
SharePoint is no longer just a content repository.
It is part of a broader digital workplace.
That includes:
- Teams collaboration
- OneDrive usage
- Copilot interaction
- Cross workload navigation
Page views cannot capture that complexity.
They were never designed to.
The Real Requirement
Modern environments require:
- Cross workload reporting
- Behavioral tracking
- Segmentation by department and role
- Tenant level analytics
Without that, insights stay fragmented.
And fragmented insights lead to fragmented decisions.
From Activity Tracking to Behavioral Insight
This is where analytics platforms need to step in.
Not to replace Microsoft reporting.
But to extend it.
CardioLog Analytics approaches this differently.
Instead of focusing on activity counts, it focuses on:
- User behavior across SharePoint and Microsoft 365
- Navigation paths and content flow
- Engagement patterns at scale
- Real adoption signals, not assumptions
CardioLog Essentials provides a focused layer for SharePoint environments specifically.
Especially useful when:
- Intranet governance is unclear
- Content sprawl is growing
- Teams need visibility without full tenant complexity
It is not about more data.
It is about better interpretation.
Practical Impact
When organizations move beyond page views, they start to see:
- Which content actually drives action
- Where users get stuck
- How navigation can be optimized
- Where adoption is real versus perceived
That clarity changes strategy.
A Small Reality Check
Everyone says more content improves engagement.
It does not. Not by itself.
In many environments, more content increases noise.
And noise increases friction.
You see it in:
- Duplicate pages
- Conflicting information
- Overlapping communication channels
Page views do not show that.
But users feel it.
Related Reading
For deeper context on SharePoint analytics and reporting:
- https://www.intlock.com/blog/sharepoint-analytics/
- https://www.intlock.com/blog/microsoft-365-usage-analytics/
- https://www.intlock.com/blog/intranet-engagement-metrics/
External perspectives on digital workplace measurement:
- https://www.gartner.com/en/information-technology
- https://www.mckinsey.com/capabilities/people-and-organizational-performance
- https://www.forrester.com
What High Performing Tenants Do Differently
They stop reporting activity.
They start measuring behavior.
They invest in:
- Tenant level analytics
- Clear engagement definitions
- Governance aligned reporting
- Continuous optimization
They also rethink KPIs.
Page views still exist.
But they are no longer the headline.
The Shift
From:
- Page views
- Visits
- Surface metrics
To:
- Engagement depth
- Navigation clarity
- Content effectiveness
- Measurable productivity
That is the shift.
Where This Is Headed
Digital workplace maturity is no longer about deployment.
It is about visibility.
Organizations that succeed will:
- Optimize licensing based on real usage
- Measure adoption beyond activity
- Align reporting with business outcomes
- Eliminate blind spots in user behavior
That is where ROI becomes clear.
Take the Next Step
If you are still relying on page views, you are missing the bigger picture.
See what your users actually do.





 Follow @cardiolog