Leadership Dashboard Overview
Focus on the key metrics that matter most

CardioLog Analytics’s leadership dashboard aims to empower organizations using SharePoint with actionable insights to optimize their digital workspace, improve employee engagement, and make data-driven decisions to enhance overall productivity and user experience
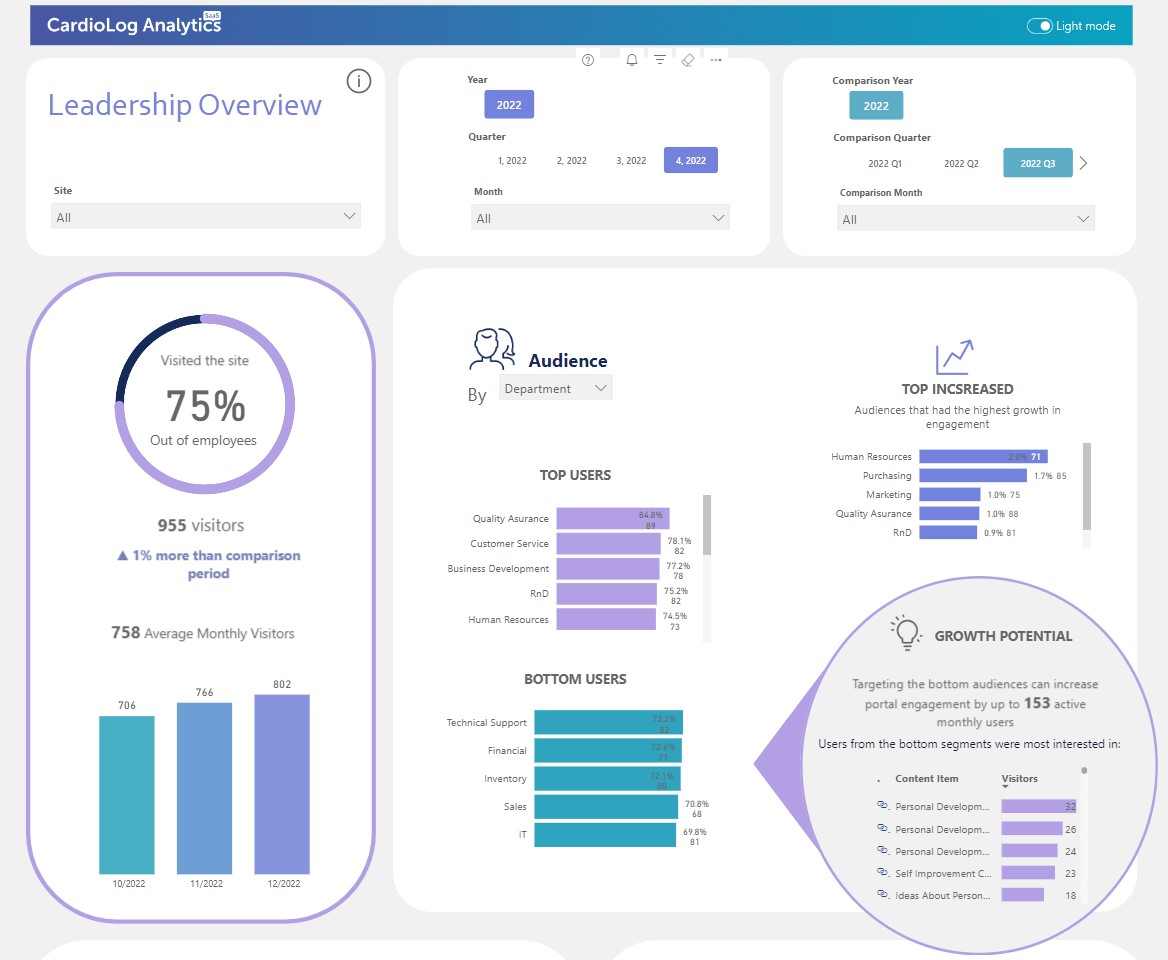
Discover our new Power BI dashboard designed specifically for leadership. It consolidates key metrics from CardioLog Analytics to provide a clear overview of portal performance, growth potential, and actionable insights for improvement.
Key Features
- Performance Metrics: Monitor employee engagement, track growth, and analyze visitor statistics for strategic planning.
- Customization and Flexibility: Segment user data, add custom metrics, and select adaptable reporting periods to suit organizational needs.
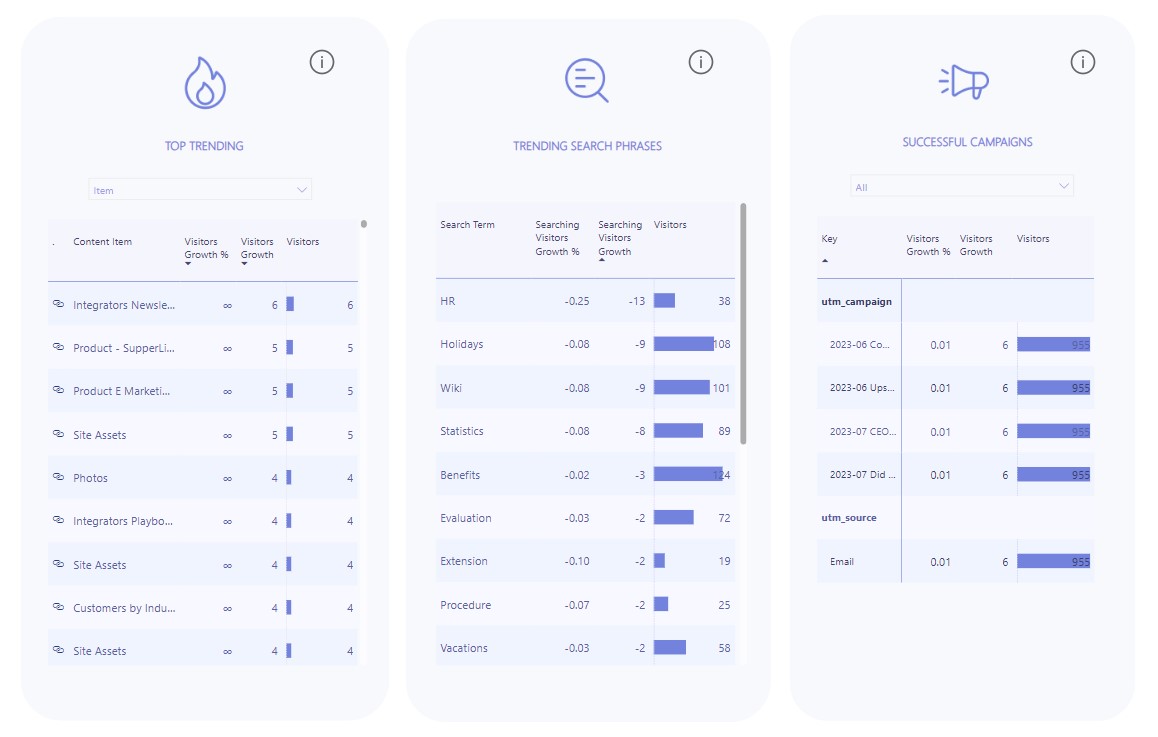
- Insights and Recommendations: Implement strategies for user engagement, optimize content, and measure campaign effectiveness to drive better results.
- Export Capabilities: Easily generate and distribute reports in PowerPoint or PDF formats, facilitating seamless presentations and data sharing.
The leadership dashboard for SharePoint Online offers a powerful solution for organizations aiming to boost their portal’s effectiveness and promote a collaborative, engaged work environment.
By simplifying complex data into a streamlined, easily digestible format, the dashboard provides leaders with quick, essential insights, allowing them to make informed decisions without the burden of extensive report analysis.
Why CardioLog Analytics
Designed specifically for SharePoint, Microsoft 365, Microsoft Teams, Yammer, and Exchange
- Tailored to the needs of organizations
- Deep integration allows for enriched reports that reveal deep insights – combining user behavior tracking advanced data from APIs
Comes with a built-in integration with Microsoft’s Power BI
- Stunning interactive reports
- The flexibility to visualize data-based
- Upon organizational goals
- Accessible from any device, anywhere
- Ask questions in natural language and get the right insights
- Collaborate with your teammates
Provided as a Service (or on-premise)
- Quick setup
- No need to purchase or maintain any infrastructure, we got you covered
- Never stop growing, your analytics automatically scale with you
- New features and reporting capabilities are released every month
- Hosted on Microsoft Azure cutting-edge technologies (or kept on-premise), to ensure high availability, performance, and security
Clients
Pricing

SMB Edition
$599/mo
- Basic SharePoint Usage Reports package
- Integrated with Power BI
- Flexible site collections/farms/web front ends tracking
- Flexible SharePoint user subscription model

Enterprise Edition
$1999/mo
- Complete SharePoint Usage Reports package
- Integrated with Power BI
- Flexible site collections/farms/web front ends tracking
- Scalable for high volumes of page views
- Scalable for high volumes of SharePoint users
- Enhanced engagement functionality

“Every version release of CardioLog Analytics you seem to include new and more interesting features. We are very satisfied and rank CardioLog Analytics as a top-grade SharePoint Analytics solution”
Jerry Bendobler, Systems Administrator