

The Tenant Tells the Truth
It looked fine on paper.
You saw healthy activity numbers in the Microsoft 365 admin center, yet leadership kept asking the same question. Why are we still paying for licenses that no one seems to use, and where is the ROI? Meanwhile SharePoint engagement was slipping quietly, Copilot usage was unclear, and you had no tenant wide narrative to explain what was actually happening.
Microsoft reports that organizations using Microsoft 365 Copilot have seen productivity gains in early trials, with 70 percent of users saying they were more productive in the first months of use according to Microsoft’s Work Trend Index.
https://www.microsoft.com/en-us/worklab/work-trend-index
That sounds promising. But productivity claims without tenant level analytics are guesswork.
Measuring Microsoft 365 adoption across the entire tenant requires more than counting logins. It demands behavioral measurement, cross workload reporting, and financial alignment. Anything less is partial visibility. And partial visibility is expensive.
Why Tenant Level Analytics Changes the Conversation
Most organizations begin with workload silos.
SharePoint admins review site usage. Teams owners look at channel activity. Security teams analyze audit logs. Each group sees a fragment. No one sees the full behavioral pattern across Exchange, Teams, SharePoint, OneDrive, and Copilot.
This fragmentation creates:
• Content sprawl that no one owns
• Navigation entropy across intranets
• UI friction that suppresses engagement
• Search abandonment with no root cause visibility
• License allocation decisions based on static reports
Tenant analytics consolidates these signals into one measurement model. That is the difference.
CardioLog Analytics was built specifically for cross workload reporting at scale. It connects behavioral data across Microsoft 365 services and transforms it into actionable tenant intelligence rather than isolated activity counts.
[Insert Heatmap Graphic Showing Engagement Drop Off]
Why Native Microsoft 365 Reporting Is Not Enough
The Microsoft 365 admin center provides surface level metrics.
Active users. Storage consumption. Basic workload activity. These are operational counters, not behavioral insights.
They do not answer:
• Are users collaborating effectively across workloads?
• Where does adoption fatigue begin?
• Which departments show early Copilot experimentation versus stagnation?
• Where is search abandonment highest?
• Which licensing tiers are underutilized relative to cost?
Gartner has consistently emphasized the importance of digital employee experience measurement beyond raw usage data.
https://www.gartner.com/en/documents/digital-employee-experience
Activity is not adoption. It never was.
True Microsoft 365 analytics measures engagement depth, navigation paths, repeat behavioral patterns, and friction points across the tenant. That requires structured data modeling, ETL normalization, and historical trend analysis.
This is where enterprise grade tenant analytics separates serious programs from checkbox reporting.
The Real Cost of License Sprawl
Let us talk about money.
Microsoft 365 licensing tiers are complex. E3, E5, Copilot add ons, Power BI Pro, Teams Premium. When license optimization is reactive, organizations overprovision by default.
You have probably seen this. Thousands of E5 licenses assigned because “it might be needed.”
Without tenant level analytics you cannot correlate:
• Feature consumption by license tier
• Copilot interaction frequency
• Advanced security usage versus entitlement
• Power BI utilization relative to assigned capacity
This leads to predictable waste.
McKinsey estimates that large enterprises waste 20 to 30 percent of SaaS spend due to underutilization.
https://www.mckinsey.com/capabilities/mckinsey-digital/our-insights
Microsoft 365 is no exception.
CardioLog Analytics aligns feature usage, behavioral intensity, and license cost models. It provides financial framing, not just technical reporting. That clarity changes budget conversations from defensive to strategic.
[Insert License Optimization Comparison Table]
Measuring Copilot Adoption the Right Way
Everyone says Copilot will fix adoption.
It will not. Not by itself.
Copilot analytics requires more than activation metrics. You need to understand:
• Prompt frequency per department
• Cross workload Copilot engagement patterns
• Behavioral uplift compared to non Copilot users
• Content creation velocity shifts
• Collaboration density changes
Forrester’s research on AI adoption highlights that measurable value emerges when AI usage is tied to workflow integration rather than feature access alone.
https://www.forrester.com
If Copilot is enabled but not embedded in daily workflows, it becomes another line item.
Tenant level analytics reveals where Copilot enhances productivity and where it is ignored. That distinction is critical for executive reporting.
SharePoint Adoption Requires Precision
Not every organization needs full tenant analytics immediately.
Sometimes the urgent issue is SharePoint intranet reporting. Page engagement is dropping. Communication sites are bloated. Governance rules exist but are not enforced.
In those cases, SharePoint focused analytics is the right entry point.
CardioLog Essentials provides:
• SharePoint usage tracking
• SharePoint heatmaps for content performance
• Navigation path analysis
• Search analytics and abandonment insights
• Content lifecycle visibility
It addresses intranet governance with operational specificity. Not vague engagement dashboards. Real structural insight.
You can explore deeper SharePoint engagement measurement approaches in this guide to SharePoint usage tracking on the Intlock blog.
https://www.intlock.com/blog/sharepoint-usage-tracking/
[Insert Before and After Navigation Flow Example]
Behavioral Measurement Beyond Activity Counts
Here is where many analytics strategies stall.
They count events. They do not measure behavior.
Behavioral Microsoft 365 analytics examines:
• Repeat visit frequency across workloads
• Cross service collaboration density
• Time between content creation and engagement
• Departmental engagement variance
• Navigation loops that indicate UI friction
I once worked with an organization convinced their intranet was thriving because page views were high. Heatmaps revealed that 60 percent of clicks were concentrated in one outdated policy page because employees could not find the updated version. High activity masked low clarity.
That is the real risk.
Behavioral insight prevents false confidence.
For organizations focused on digital workplace maturity, the Intlock blog article on improving digital workplace engagement expands on this concept.
https://www.intlock.com/blog/digital-workplace-engagement/
Governance Clarity Through Analytics Architecture
Governance documents alone do not drive adoption.
Operational analytics does.
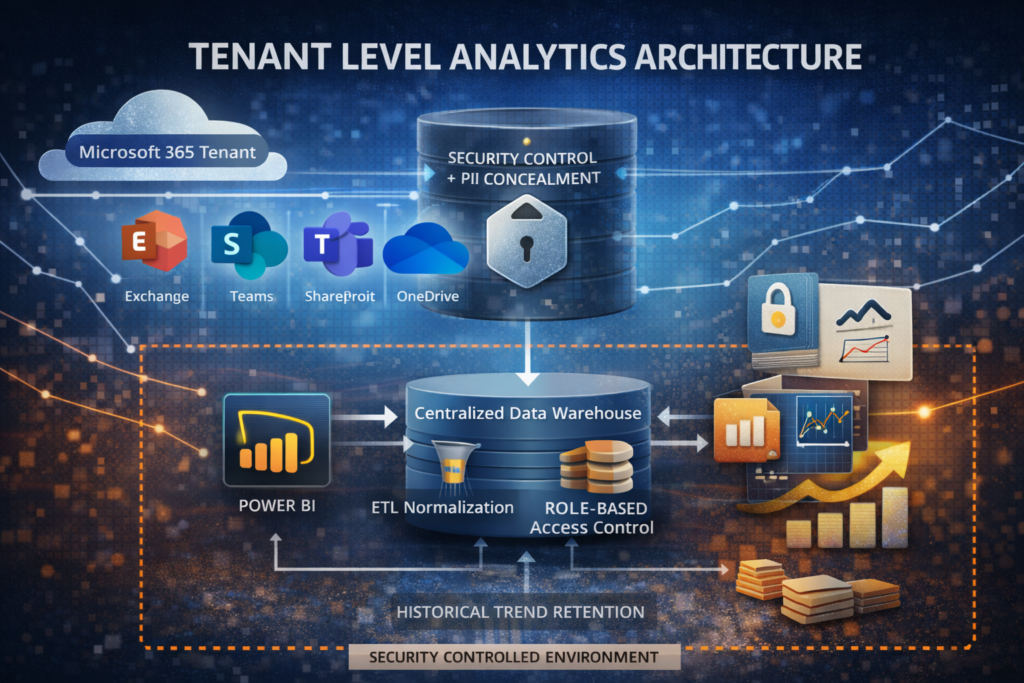
Tenant level analytics architecture should include:
• Centralized data warehousing
• Cross workload normalization
• Historical trend retention
• Role based access control
• PII concealment where required
Governance becomes measurable when you can see content sprawl growth rates, orphaned site expansion, and collaboration network density over time.
CardioLog Analytics supports this enterprise architecture model. It integrates with Power BI for advanced visualization while maintaining tenant level granularity. It also aligns with security requirements common in regulated industries.
You can review additional insights on Microsoft 365 governance measurement strategies here.
https://www.intlock.com/blog/microsoft-365-governance/
What High Performing Tenants Do Differently
High performing tenants do not rely on vanity metrics.
They align analytics with financial impact, behavioral change, and governance clarity.
They focus on:
• License optimization tied to feature consumption
• Measurable Copilot adoption
• Reduced navigation entropy
• Lower search abandonment
• Clear ownership of digital workplace performance
Microsoft 365 analytics is no longer optional overhead. It is operational intelligence.
When tenant analytics is structured correctly, you stop reacting to executive questions. You anticipate them.
That is the shift.
If your organization is ready to move beyond surface reporting and into measurable adoption and license optimization, schedule a demo of CardioLog Analytics.
Clarity is available. You just need the right lens.


 Follow @cardiolog