

Do you know what 82% of your website visitors are ignoring right now?
That statistic isn’t hyperbole; it represents the vast amount of effort, content, and conversion opportunity lost because most organizations simply don’t understand where their audience is looking. If your ultimate goal is to increase conversions, boost engagement, or simply ensure your internal teams are finding the information they need, relying on standard page-view metrics alone is like navigating a busy city with only a paper map. You need X-ray vision. This is where the visual power of heatmap analysis transforms your entire approach to web optimization and user experience (UX).
You might be wondering: “My existing analytics package tells me what pages are popular—isn’t that enough?” Not quite. Standard analytics tell you where users land; heatmap analysis shows you what they do and what they miss once they are there. This depth of visibility is crucial for high-performing websites and, more specifically, complex portals like those built on Microsoft 365, where maximizing adoption is paramount. This deep-dive into user behavior is the foundational expertise that drives meaningful, impactful change on any digital platform.
What is Heatmap Analysis?
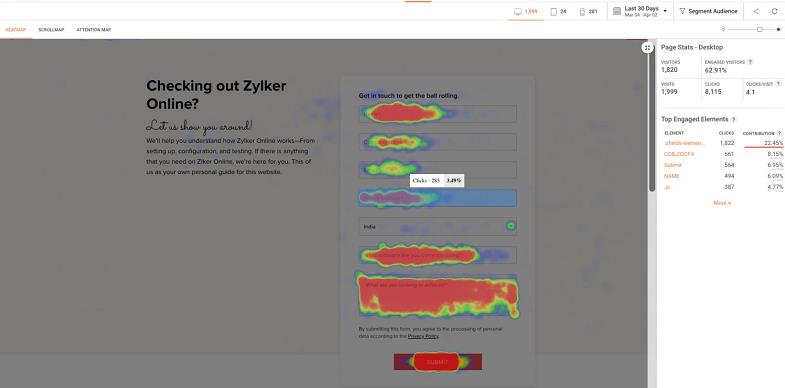
The simplest, most accurate definition of heatmap analysis is that it provides a visual representation of user behavior on your web page. Think of it as a pair of spy vision goggles that allow you to gain crucial data on user interaction that would otherwise remain hidden in raw data logs.
Heatmaps visually superimpose data points onto a webpage screenshot, using a gradient of colors—usually ranging from red (most active/hot) to blue (least active/cold)—to illustrate concentration, clicks, and scrolling depth. This immediate visual feedback makes identifying usability issues dramatically faster and clearer than sifting through spreadsheets.
It is one of the best innovations when it comes to the UX design approach. It empowers you to pinpoint subtle usability issues, truly understand the effectiveness of your Call-to-Action (CTA) buttons, and identify triggers that encourage deeper user navigation, ultimately leading to higher goal completion.
Connecting Heatmaps to Business Objectives
While a heatmap looks visually appealing, its true value lies in how it connects user actions (or inactions) to your business goals. For instance, if you are running an internal SharePoint portal, a heatmap doesn’t just show clicks; it tells you:
- Are employees clicking the links to the new HR policy documents?
- Are they seeing the corporate communications posted above the fold?
- Is the new navigation menu actually being used, or is it being ignored?
By having this visual data, you can map out exactly what needs to be changed and how to apply those changes to supercharge your platform’s performance.

What Crucial Data Does a Heatmap Reveal?
A comprehensive heatmap analysis can provide several crucial data points that, when cross-analyzed, reveal a complete story of user engagement. Understanding these different types of data is essential for effective optimization.
1. Clicks (The “Where”)
This is the most well-known heatmap data. A click map shows you precisely where visitors are clicking on your page. The most valuable insight here isn’t just what they click, but what they try to click that isn’t clickable. For example, if a headline or an image has a high concentration of clicks but isn’t a link, it indicates a design error—the user expects that element to be a navigational cue.
2. Scroll (The “How Far”)
A scroll map provides a visual representation of your visitors’ scroll depth. The color gradient shows you how far visitors scroll down the page before they lose interest, leave, or navigate elsewhere. This gives you a clear indication of where the “average fold” lies—the critical boundary where user attention drops off significantly. Content placed below this line is often missed.
3. Engagement/Hover (The “Focus”)
Also known as an attention map, this data shows you areas where users engage or hover the mouse cursor for an extended period. While not always a perfect proxy for true engagement, it is a very good indicator of which content users are actively consuming or finding interesting enough to pause on. A high-engagement area confirms your content is resonating; a low-engagement area suggests it needs to be redesigned or moved.
4. Eye Tracking (The “Look”)
While often achieved through specialized, more expensive lab studies, some advanced heatmap solutions offer data correlating cursor movement to approximate eye movement. This helps you identify the elements with the highest fixation points on the screen. It can confirm whether your eyes are drawn to a headline or an image, which is invaluable for improving content hierarchy and placement.

Translating Heatmap Analytics into Action Points
Heatmap data is just the starting line. The real benefit comes when you translate those visual insights into a clear plan to boost engagement and conversions.
Action Point 1: Maximize Above-the-Fold Content
Your scroll data defines the “average fold”—the point where user attention drops off.
- The Problem: Crucial information placed below this line is often missed. Users might leave before actively scrolling down.
- The Fix: Use scroll data to determine the ideal placement for your most valuable content (CTAs, vital announcements, primary navigation). If only 50% of users scroll past the first screen, put your most critical elements at the top for maximum visibility.
Action Point 2: Optimize the Call to Action (CTA)
Your CTA buttons are essential for conversion. Click analytics confirm if they are effective.
- The Data: Review the click map to see if users are engaging with the button or if they are clicking nearby non-clickable elements (a design error).
- The Fix: Ensure your CTA buttons are highly visible, visually compelling, and positioned correctly. If a button is “cold” (The Zero-Click Problem), it needs better prominence, clearer surrounding copy, or a better position in the user journey.
Action Point 3: Declutter for Focus
In UX design, less is often more. Too many elements on a page can lead to user distraction.
- The Data: Look at hover and click data. If cursor activity is scattered everywhere, it signals a lack of focus and direction in the page layout.
- The Fix: Remove superfluous images or low-value links. Boost interaction on the most important elements by properly placing them and designing your key buttons to be the most compelling visual targets.
Action Point 4: Improve Internal Search Functionality
For corporate portals (SharePoint/Teams), successful search is vital to avoiding help desk calls and user frustration.
Heatmap analytics helps IT and Comms teams refine the search experience:
- Failure Analysis: See where users click after a failed search attempt.
- Relevance Check: Identify which search results users click on most often.
- User Frustration: Determine if users are constantly clicking back to the search bar because their initial queries did not yield useful results.
This data allows you to refine search dictionaries, tag content more accurately, and reduce user friction.
Transforming Data into Definitive Strategy
Heatmap analytics is a vital step you can take to ensure that you are optimizing website performance. However, generating clear, cohesive insights from numerous data sources—click maps, scroll maps, raw traffic numbers—remains a big challenge for most businesses.
This is where the next evolution of analytics comes into play. While standard heatmaps show you where the problem is, Augmented Analytics pinpoints the specific, problematic areas on your web or SharePoint page and provides the prescription for change, helping you take action based directly on unified data.
For organizations leveraging complex digital platforms like Microsoft 365, gaining this level of visibility is no longer optional—it is essential for proving the ROI of the platform itself.
Ready to Reveal Your Users’ True Intent?
Understanding user behavior shouldn’t feel like guesswork. CardioLog Analytics is designed to give you that “spy vision” for your digital workspace, combining powerful heatmap data with deep usage metrics unique to complex enterprise environments.
If you’re ready to stop guessing and start knowing exactly what changes will drive the highest engagement and adoption rates, we are here to help.
Ready to see the full picture of your user behavior, have a look at this video.
➡️ Request a Personalized Demo today and start turning hidden usage data into definitive action plans!

Do you have too many elements on your page?
Less is more. This is mostly true with web design, especially in terms of UX design.
When there are too many elements on one page, it can distract your visitors from the most important action you want them to take. Look at the heatmap data. Is the user’s cursor activity all over the place? If this is the case, it can indicate that there is a lack of focus and direction when it comes to the placement of your page elements.
Boost interaction on the most important elements by evaluating their position properly and designing your buttons to make them compelling.
Heatmap analytics is a vital step you can take to ensure that you are optimizing website performance. Generating insights from various data sources remains a big challenge for most businesses. Augmented Analytics pinpoints problematic areas on the web or SharePoint page so you can take action based on the data.
FAQs about Heatmaps Analytics
What is heatmap analytics?
Heatmap analytics is a tool that collects data on how users interact with a webpage, capturing information like where they click, how far they scroll, and even where their mouse hovers. It provides visual insights into user behavior to improve website performance and user experience.
What is the purpose of a heatmap?
A heatmap visually represents data using color codes, with the primary goal of highlighting areas on a webpage that attract the most attention. It helps businesses understand key engagement points, ensuring that essential content is placed effectively to capture users’ focus.
How do you analyze a heatmap on a website?
Analyzing a heatmap involves several steps. First, review the data to understand which sections of the page are engaging users and which are not. Formulate a hypothesis about why certain areas perform better or worse. Then, test a revised design to improve the user experience and overall website effectiveness.
How do heatmaps contribute to web analytics?
Heatmaps are a valuable tool within web analytics as they visually represent user behavior on web pages. By showing click patterns, scrolling behavior, and areas of focus, heatmaps allow businesses to make data-driven decisions about content placement, navigation, and design improvements.
How can heatmap analytics improve your website’s performance?
Heatmap analytics helps website owners identify crucial user behavior patterns, such as how visitors interact with content or respond to call-to-action buttons. This insight allows for targeted changes that can increase engagement, optimize content visibility, and ultimately drive conversions.


 Follow @cardiolog