SharePoint usage numbers can be misleading.
They look precise. They rarely explain anything.
If you manage a modern SharePoint environment, you have probably seen this play out. Pages get views. Engagement still drops. Leadership asks whether the intranet is working. You do not have a confident answer.
Native SharePoint reports show activity. They do not show behavior.
That gap is usually where Google Analytics enters the discussion.
Why Native SharePoint Analytics Fall Short
Modern SharePoint provides site usage reports out of the box. You can see visits, viewers, and popular pages. For basic reporting, that helps.
But once you try to improve adoption, the cracks show quickly.
You cannot see how users move between pages.
You cannot measure interaction with links or buttons.
You cannot tell where users disengage.
For internal comms and IT teams, that lack of context becomes frustrating fast.
What Google Analytics Actually Adds
Google Analytics focuses on patterns, not just totals.
When connected to a modern SharePoint site, it can help you understand:
• How often users return
• How long they stay on key pages
• Which paths users take through navigation
• When activity spikes or drops
It does not magically solve SharePoint analytics. But it does expose behavior that native reports hide.
That alone makes it useful.
What You Need Before You Start
Before adding Google Analytics to modern SharePoint, make sure the basics are covered:
• A Google Analytics GA4 property
• The Measurement ID
• SharePoint tenant admin access
• A development environment
If you do not have admin access, stop here. You will not get far.
How to Add Google Analytics to the Modern SharePoint
This part matters.
Modern SharePoint does not allow arbitrary script injection. There is no supported way to paste tracking code into a page.
The correct approach is SharePoint Framework.
Step 1: Use an SPFx Application Customizer
An SPFx Application Customizer lets you load JavaScript on modern pages without breaking support or security boundaries.
This is the only reliable method.
Step 2: Create the SPFx Extension
From the command line, generate a new SPFx project.
Choose an Application Customizer when prompted. This ensures the code runs consistently across pages.
Nothing fancy here. Just the right tool.
Step 3: Load the Google Analytics Script
Inside the extension, load the Google Analytics script asynchronously and initialize it with your Measurement ID.
Important points that are often missed:
• Load the script once
• Avoid blocking page rendering
• Keep configuration minimal
Overengineering this step causes more problems than it solves.
Step 4: Deploy to the Tenant
Once built:
• Package the solution
• Upload it to the App Catalog
• Approve the deployment
• Associate it with target sites
Deployment errors usually come from permissions or missing approvals. Double-check both.
Step 5: Confirm Data Collection
Open Google Analytics and check real-time activity.
Navigate your SharePoint site. Click links. Refresh pages.
If you see activity, tracking works.
If not, fix it now. Waiting only makes it harder.
Known Limitations of Google Analytics in SharePoint
This is where expectations need adjustment.
Google Analytics was designed for public websites. SharePoint is an authenticated platform.
That mismatch creates limitations:
• No native user identity tracking
• Limited understanding of permissions
• Privacy considerations for internal traffic
• Weak reporting on SharePoint specific actions
You can still use it. Just do not expect it to answer everything.
When Google Analytics Is Enough
Google Analytics works well when you want:
• High-level engagement trends
• Real-time activity checks
• Navigation analysis
• Campaign validation
For many teams, this is a reasonable starting point.
But starting points are not strategies.

Why Many Teams Outgrow Google Analytics
As SharePoint matures, analytics questions change.
You stop asking how many visits a page gets.
You start asking who uses what, and why.
Questions like:
• Which departments actually adopt new sites
• Which content supports real work
• Where productivity drops
• Which licenses go unused
Google Analytics was not built for this.
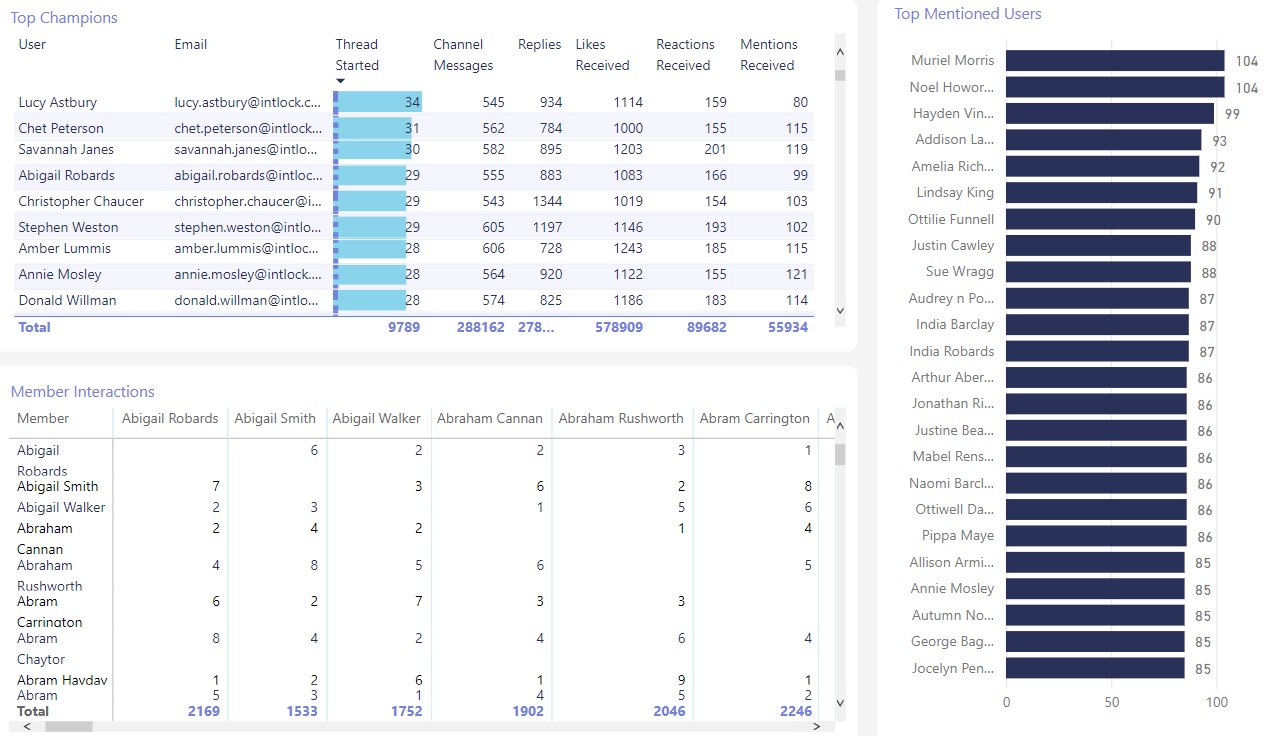
Where CardioLog Analytics Becomes Relevant
This is the gap CardioLog Analytics was designed to close.
CardioLog analyzes SharePoint and Microsoft 365 usage at the tenant level, with full awareness of authentication, permissions, and content structure.
You gain:
• Authenticated user insights
• Role-based dashboards
• Content and site adoption trends
• License usage visibility
It turns activity data into something operational teams can actually act on.
Many organizations use Google Analytics for surface-level behavior and CardioLog Analytics for decision-making. The tools serve different purposes.
Using Analytics to Improve SharePoint, Not Just Measure It
Adding Google Analytics to modern SharePoint is a technical step.
Using analytics to improve adoption is a mindset shift.
If you only report numbers, nothing changes.
If you analyze behavior, things do.
What to Do Next
If your SharePoint environment supports daily work, analytics should reflect that reality.
CardioLog Analytics provides insight designed for Microsoft 365, not adapted from the public web.
Schedule a demo and see how SharePoint analytics looks when it is built for SharePoint.


 Follow @cardiolog