
Setting up detailed analytics for your SharePoint site has never been easier, thanks to our automated configuration wizard. The tool includes a number of time-saving features, most notably the ability to automatically place tracking code on your SharePoint pages, freeing you from the need to insert the tracking code manually on your pages through the backend.
Our easy deployment wizard also features full integration with your SharePoint farm and enables you to load your portal’s entire tree structure into CardioLog Analytics, thereby allowing you to easily report on different sections of your portal.
- Simple-to-use configuration wizard makes setting up analytics a breeze
- Automatically install tracking code onto your SharePoint site
- Interface with your site’s tree structure
- Step-by-step user interface keeps installation organized
CardioLog Analytics’ configuration wizard is a helping hand that simplifies a normally complicated and time-consuming task, allowing you to deploy analytics on your site in a matter of minutes.
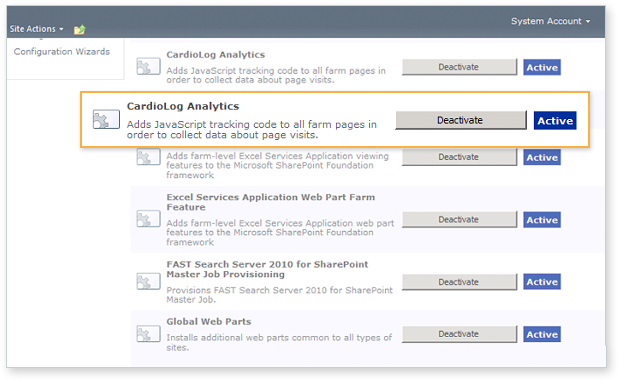
Perhaps the biggest time-saving feature is the option to automatically insert the JavaScript tracking code for CardioLog Analytics onto all of your farm’s pages. By choosing this option, the configuration wizard automatically installs and activates a dedicated SharePoint farm feature, which inserts the JavaScript tracking code onto all of the pages.
Even after the code is installed, removing the code is equally simple, and can be accomplished by deactivating the farm feature, ensuring you never have to manually modify any code. Plus, when new sites and pages are added to your farm, they will be tracked automatically, eliminating the need to repeat the process as you expand the capabilities of your portal.
The configuration wizard is also programmed to integrate with your intranet portal’s site tree and display the information in a visually intuitive way with the CardioLog Object Explorer. Once integrated, this feature will allow you to easily and quickly report on different sections of your portal, from entire directories or subdirectories, down to individual pages and documents. You can also compare the performance of different sections by selecting these in Object Explorer. And finding specific items of your portal is made simple through the search box, which allows you to pull up any site, directory, page or document in a matter of seconds.
The tree view is a great way to browse and compare sections of your site via relevant content grouping. And the content drilldown layout allows you to navigate large sites with ease, by simply scrolling down the listed subsections.
The result is a bird’s-eye-view of your site that is both intuitive and useful in determining which areas are performing best.
CardioLog Analytics is dedicated to making the process of setting up your analytics as simple as possible, and our configuration wizard is just one of the many tools that makes this a reality.