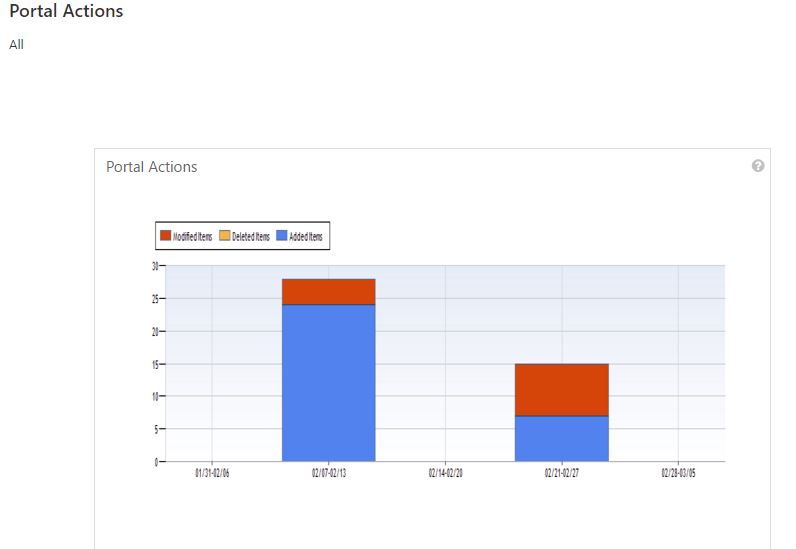
This report’s chart displays the number of portal items which were added, deleted or modified within a specific time frame. Data is displayed in an aggregated mode.
Home » Products » SharePoint Analytics & Reporting – Microsoft 365 Reporting Solutions » Reports » Portal Growth » PORTAL ACTIONS – SHAREPOINT USAGE REPORT