

In the modern digital workplace, video has become the primary vehicle for internal communication, training, and executive messaging. However, simply hosting a video on SharePoint or Microsoft Stream isn’t enough. To truly understand your ROI, you need actionable SharePoint video analytics that go beyond basic view counts.
Why Video Tracking is Critical for Your Intranet
Microsoft SharePoint has evolved into a powerhouse for video communications. From team-site training to enterprise-wide portals, video allows organizations to deliver dense information rapidly. But without a dedicated analytics layer like CardioLog Analytics, these investments are often a “black box.”
CardioLog Analytics bridges the gap between content creation and audience insights, providing a cross-platform view of how your employees consume visual media.
Advanced Video Reporting Features
To optimize your video strategy, CardioLog Analytics provides four essential reporting pillars:
1. Video Engagement & Interaction Metrics
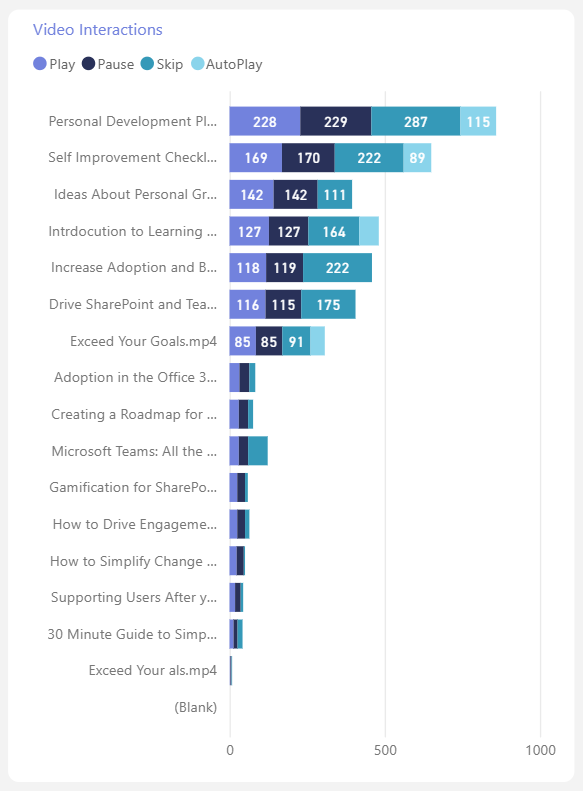
Don’t just track views—track behavior. Our Video Interaction Report ranks content based on deep engagement. By measuring play-button clicks versus automatic plays, you can distinguish between passive exposure and active interest.
- Key Insight: Identify which videos have high “drop-off” rates to improve your content length and quality.
2. Active vs. Inactive Content Audit
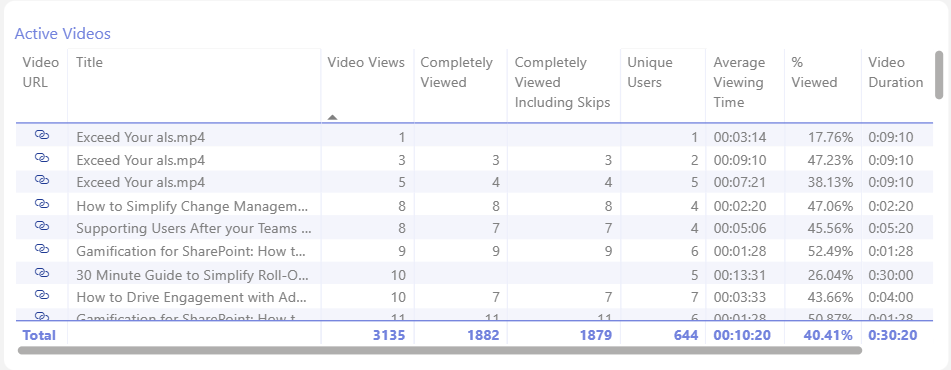
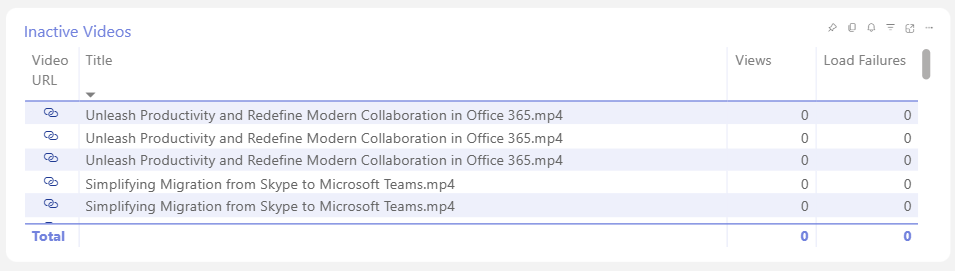
Our Active Videos Report highlights your top performers, while the Inactive Videos Report flags content that appears on a page but is never played.
- Actionable Data: Use these reports to “prune” your portal, removing broken links or unappealing thumbnails that clutter the user experience.
3. Identifying Your “Star Players”
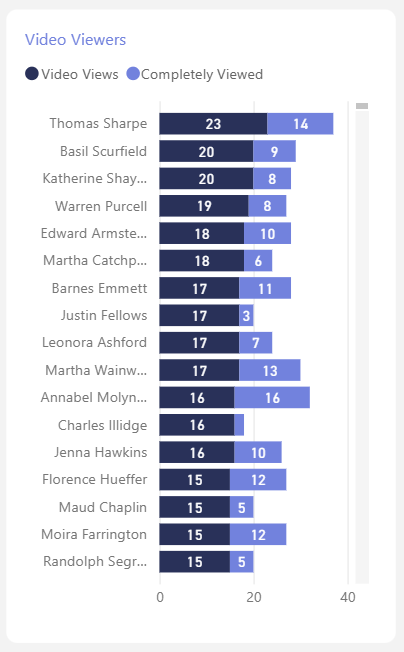
The Video Viewers Report identifies your most engaged users. By pinpointing power users, internal comms teams can leverage these “star players” as champions for portal collaboration and peer-to-peer training.
4. Cross-Player Compatibility
Unlike native tools, CardioLog Analytics is compatible with virtually any video player integrated into your SharePoint environment. Whether you are using Microsoft Stream, YouTube embeds, or third-party players, your data remains centralized.
How Video Metrics Drive Business Value
- Increase Efficiency: Validate if videos are actually reducing support tickets or training time.
- Improve Strategy: Reassess low-performing video campaigns in real-time.
Optimize ROI: Stop guessing which formats work. Use hard data to justify your video production budget.
Driving ROI with Video Intelligence
What can Video Reporting and Metrics do for You?
Investing in video is an investment in your workforce’s time. While Microsoft provides the platform to enrich the SharePoint experience, CardioLog Analytics provides the visibility needed to ensure that investment pays off.
Generating deep insights into video usage allows your internal comms and IT teams to:
- Validate Content Impact: Transition from “guessing” to “knowing” by measuring how video content directly impacts user efficiency and knowledge retention.
- Optimize Digital Spend: Ensure your SharePoint portal is functioning at peak performance by identifying which high-production assets are driving value and which are being ignored.
- Bridge the Data Gap: While a picture is worth a thousand words, a tracked video provides a thousand data points. CardioLog Analytics captures the interactions that native tools miss, turning video consumption into a measurable business outcome.
Don’t let your video strategy sit in the dark. Turn your SharePoint portal into a data-driven powerhouse where every play button click contributes to a more streamlined, informed organization.