
Tracking funnels in Google Analytics – Part II
In my last post, I wrote about researching the best ways to track and present chronological and multi-visit funnels for my site. In this post, I will show you what happens when I implement John’s solution on a few basic funnels.
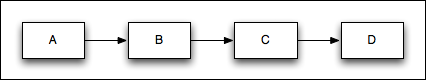
For my test, I created a simple site with 4 pages: A, B, C, and D. I also created 3 profiles in Google Analytics for this site:
- The Master Profile, with 4 goals (A, B, C, and D. Goal #1 = A, Goal #2 = B, etc.)
- Funnel Test no. 1, based on John’s solution – 4 goals (A, B, C and D). I set each preceding goal as the first step for the following goal, so that Goal #2 was defined with “Goal URL = B” and with “Step 1 URL = A”)
- Funnel Test no. 2 – similar to “Funnel Test no. 1″, but with step 1 defined as a required step.
The next thing I did was imitate 5 different user flows:
User #1 went from A to B to C to D, all in one visit.
User #2 went from A to B in one visit, to C during another visit, and finally to D in the following visit. (In total, this user went through all 4 pages during 3 visits)
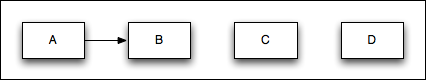
User #3 went from A to B in one visit.

User #4 went to A, and during a later visit went to B and C.

User #5 went from A to D to C in one visit.

In total, we had 5 unique users, 8 visits, and 16 pageviews.
If my funnel is A -> B -> C -> D, then in a perfect world, with the perfect tool, I would expect to receive the following statistics:
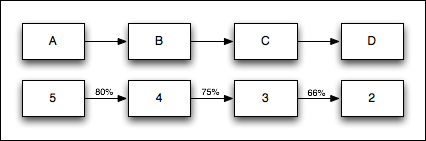
The fact that User #5 visited page D and then page C should not be included in the funnel, because my funnel definition requires my users to first go through B, then through C, and only then visit D.
Now let’s take a look at the Google Analytics
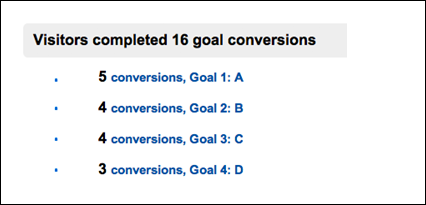
All three profiles resulted in the same amount of goals:
The first odd behavior I noticed was the fact that profile “Funnel Test no. 2” (where step 1 was required) reported 4 conversions of Goal 2 (page B), but when I looked at the funnel visualization, I only saw 3 conversions. I knew this funnel visualization was correct, as User #4 had not gone through pages A and B during the same visit, and the goal was set with a required step 1. At first, it looked like a bug (as one report showed 4 conversions yet the other correctly only showed 3), but then I realized that I was not familiar enough with how the “required step 1” might affect my goals. A quick read of GA’s help section led me to the following statement: “Note that the “˜Required step’ checkbox only affects the Funnel Visualization report. It does not keep a goal from showing conversion in any other goal report.” I guess this explains it.
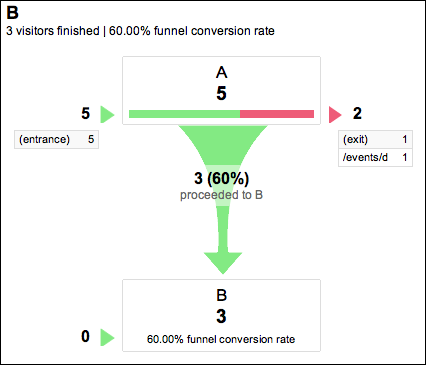
In this figure, you can see that the funnel visualization report shows 3 conversions.
The second odd thing was that the funnel visualization of goal 3 (page C) showed the following:
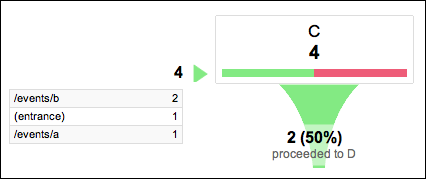
If we look at the paths people used to get to page C, we can see that 2 visitors came from page B (users #1 and #4) and one came directly to page C(user #2) – all correct procedures – but there was also one user who came directly from page A, which is incorrect – User #5 went from page D to page C, and not from page A.
At that point, I was not sure if my test had run properly (I thought I may have gone from A to C?), so I checked the navigation summary and found out that:
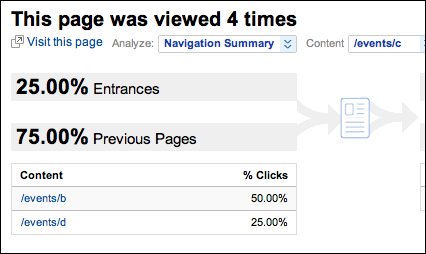
Page C was visited 4 times: once directly, twice from page B, and once from page D.
I cannot explain this behavior. As far as I understand the funnel visualization report, its data should match the navigation summary report, but for some reason it is different.
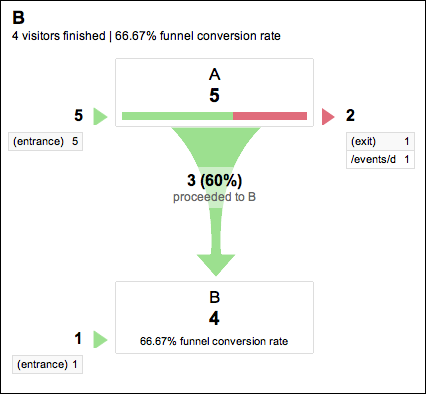
The last thing I noticed was that the horizontal funnel presented incorrect numbers, probably due to the fact that some of the goals were achieved over more than one visit. I also noticed that when using this method, I could not force Google Analytics to calculate the funnel based on the order of events (User #5 should therefore not be counted in this funnel, as he/she visited page A, then page D and only than page C).

As you can see, the numbers make no sense. For example, there were 5 people who achieved Goal #1, and 4 users that achieved Goal #2, while the abandonment rate between the two goals was 33.33%.
I wanted to make sure I understood the numbers that GA had calculated:
- There were 5 users who had visited page A
- There were 4 users who had visited page B: Three users came from page A during the same visit (Users #1, 2, and 3) and one user came directly to page B (User #4).
- The abandonment rate between Goal 1 (page A) and Goal 2 (page B) was 33.33%, which does not seem correct at first glance: As we had 5 users and 4 conversions, we should have had a 20% abandonment rate. The reason GA shows us 33.33% is because GA looks at visits and not at visitors. Let’s take a look at the funnel visualization report for Goal 2:
You can see that GA counted 5 visits to page A, where 3 of those visits did get to page B and one additional visit went directly to page B. This visit also converted, so in total GA counted 4 converted visits out of a total of 6 visits = 66.66%, which means a 33.33% abandonment rate.
- There were 4 users who visited page C: Two users came from page B (Users #1 and #4), 1 visitor came directly to page C (User #2), and 1 visitor came from page D (User #5).
- The abandonment rate between goal 2 (page B) and goal 3 (page C) was 33.33%: Four visits from page B, and 2 visits directly and through page D, so in total we had 6 visits and 4 conversions = 66.66%.
- There were 3 users who visited page D: One visitor from page C (User #1), 1 directly (#2), and 1 user from page A (User #5).
- The abandonment rate here was 60%: Four visits to page C + 1 visit directly to page D, so in total we had 5 visits and 3 conversions = 60%.
I Hope I didn’t lose you along the way.
It might seem trivial to some of you, but I think it’s important to understand this and ensure you are reading your Funnel and Goal Reports correctly. I have been using Google Analytics for a few years now, but never took the time to stop and think about the numbers presented. I just accepted them. Even though from day one I knew that Google Analytics looks at visits and not visitors, I never stopped to think about the consequences of this principle and its effect on my funnels and goals.
In my next post, I will show you a different approach to this problem that might help you achieve a correct funnel using Google Analytics.


 Follow @cardiolog