Your Teams data might be hiding something.
You might think everyone’s using Microsoft Teams the way you intended—but are they really? If you’ve ever wondered whether those endless meetings and messages are actually productive, you’re not alone. Many companies roll out Teams, only to discover later that adoption is shallow or uneven.
This matters more than you might think. Poor engagement leads to miscommunication, wasted time, and missed opportunities. In fact, studies show that companies with high digital collaboration adoption are 21% more profitable than their peers.
If you’re responsible for collaboration, productivity, or IT performance, you need more than surface-level metrics. CardioLog Analytics delivers the clarity you’ve been missing.
Microsoft Teams is Microsoft’s hub for workplace communication. It brings together:

Find out more here
● Chat and messaging
● Video and voice calls
● Online meetings and webinars
● File sharing and collaborative editing
● Integrations with SharePoint, OneDrive, Outlook, and other tools

For many organizations, it’s replaced emails and hallway conversations with a digital-first way of
working.
Why You Should Track Teams Usage
Rolling out Teams is just step one. Making sure people are actually using it—and using it
well—is a different story.
Without visibility into usage, you might be missing signs of:
● Low adoption in certain teams
● Underused features
● Silos forming where collaboration should be happening
● Inefficient communication habits
That’s where usage analytics come in. With the right data, you can make better decisions and
course-correct before things fall off track.
What CardioLog Analytics Brings to the Table
CardioLog Analytics is built to give organizations insight into how Microsoft 365 tools like
Teams and SharePoint are being used. It’s more than just numbers—it tells the story of user
behavior, engagement, and collaboration.
With CardioLog, you can:
● Track usage trends
● Spot inactive users
● Understand how different teams use Teams
● Fine-tune your training or adoption plans
● Make smarter, data-driven decisions

Find our more here
How It Helps You Get More from Microsoft Teams
1. See Who’s Actually Using It
CardioLog helps you see how many people use Teams daily, weekly, or monthly—and which
departments are lagging. If engagement is lower than expected, you can act quickly.
Example: Only 60% of your staff is regularly using Teams? Time to dig into why.
2. Spot Inactive Users
Some users might rarely log in. Others might not know what Teams can do. With usage reports,
you can identify those users and follow up—maybe with training, reminders, or tips.
3. Analyze Meeting Habits
Not all meetings are productive. CardioLog breaks down meeting frequency, attendance, and
duration so you can:
● Cut down on wasted time
● Encourage quick check-ins instead of drawn-out calls
4. Track Chat and Messaging Trends
Is your company still stuck in email threads? CardioLog shows how messaging is being
used—including which groups are most active and whether people use channels or just private
chats.
That helps you promote better habits and more transparent communication.
5. Filter by Team or Department
You can slice the data any way you want—by region, team, or user group. This makes it easier
to:
● Spot strong adoption in some areas
● Offer extra support to teams that are behind
Real example: Sales is highly active, but HR isn’t? That’s a good place to focus your next
adoption push.
6. Build Custom Dashboards
Want a high-level overview or a detailed breakdown? With customizable dashboards and
exportable reports, you can:
● Share insights with leadership
● Use data in presentations or audits
● Zero in on the KPIs that matter to you
Getting Started with CardioLog Analytics for Teams
Step 1: Connect to Microsoft 365
The IT team can handle the technical part: linking CardioLog to your Teams environment and
ensuring the data flows correctly.
Step 2: Set Clear Goals
Figure out what success looks like for your Teams rollout. Do you want better adoption? More
meetings? Shorter response times? Knowing this helps focus your efforts.
Step 3: Explore the Dashboard
Once you are up and running, the dashboard gives you a real-time look at what’s happening
across your digital workplace.
Step 4: Act on What You Learn
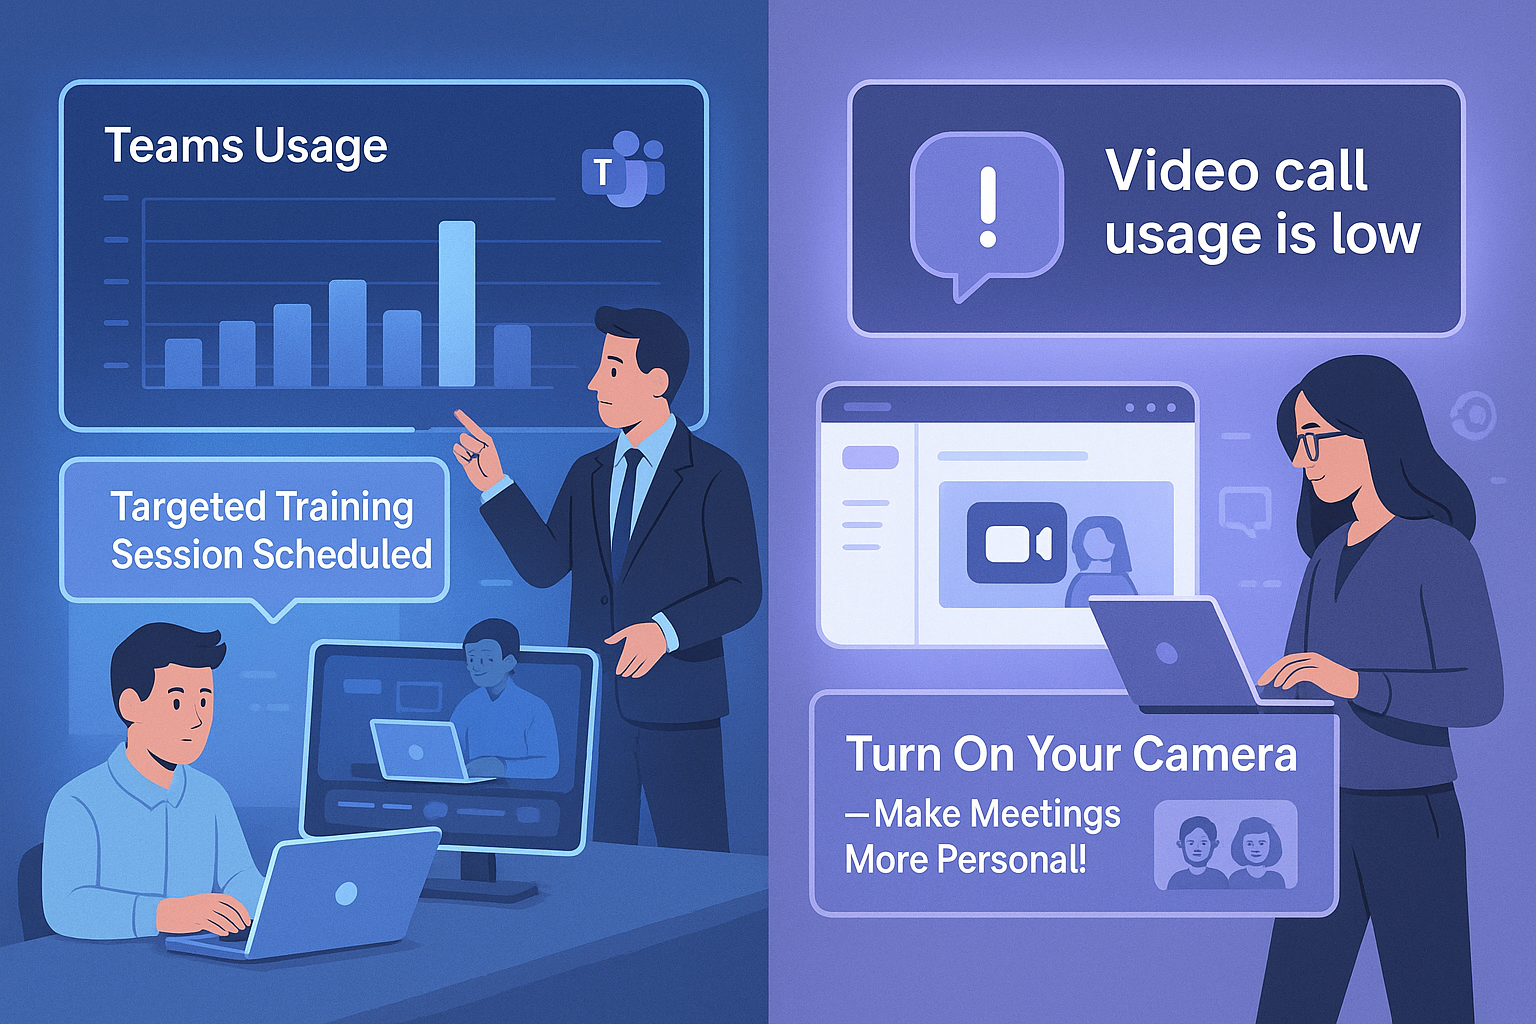
See that a certain group is barely using Teams? Roll out a targeted training session. Notice
people aren’t using video calls? Promote the feature internally.
Quick tip: Even something as simple as a weekly usage tip can make a big difference.
Step 5: Track Your Progress
Once you make changes, check back in the data to see what’s improved. Are more people
active? Are meetings shorter? Are adoption gaps closing?
That’s how you measure success—and keep improving.
 Find out more here
A Quick Case Study: TechNova Solutions
Problem: A mid-sized company noticed that less than half of their employees were using
Teams regularly.
What they did:
● Used CardioLog to spot inactive users
● Reviewed usage by department
● Launched internal awareness and training campaigns
Result:
● Usage jumped from 40% to 75%
● Meetings became shorter and more focused
● Teams began collaborating more effectively across regions
Final Takeaway
Microsoft Teams is a powerful tool—but only if people actually use it. With CardioLog
Analytics, you don’t have to guess how it’s being used. You get the real story—so you can take
action, boost engagement, and get more from your Microsoft 365 investment.
If better collaboration and communication are on your roadmap, this is a great place to start.
Would you like this edited into a downloadable blog post or formatted for a website?









 Follow @cardiolog