

Collecting and analyzing user behavior data can reveal valuable insights into how users interact with your site, what they find engaging, and where they encounter obstacles. This guide will walk you through the process of collecting and analyzing user behavior data, with a focus on using tools like SharePoint and CardioLog Analytics.
Why Collect User Behavior Data?
User behavior data encompasses various metrics, such as page views, click patterns, time spent on pages, and user navigation paths. By collecting this data, organizations can:
- Enhance User Experience: Identify and resolve pain points to create a smoother and more enjoyable user journey.
- Optimize Content and Layout: Understand which content resonates with users and optimize page layouts accordingly.
- Boost Engagement and Retention: Tailor content and features to user preferences to keep them engaged and returning.
- Inform Business Decisions: Make data-driven decisions to improve products, services, and marketing strategies.
Collecting User Behavior Data
To collect user behavior data effectively, you need the right tools and strategies in place. Here’s how you can start:
1. Implement Analytics Tools
Analytics tools are essential for tracking user behavior on your site. Google Analytics is one of the most popular options, offering a wide range of metrics and reporting features. However, for organizations using SharePoint, CardioLog Analytics is a specialized solution that provides deeper insights into user behavior within SharePoint environments.
2. Define Your Goals and KPIs
Before diving into data collection, define what you want to achieve and the key performance indicators (KPIs) that will help you measure success. Common KPIs include:

- Page Views: Number of times a page is viewed.
- Bounce Rate: Percentage of visitors who leave after viewing only one page.
- Session Duration: Average time spent on the site.
- Conversion Rate: Percentage of visitors who complete a desired action, such as filling out a form.
3. Set Up Tracking
Once your goals and KPIs are defined, set up tracking on your website. This involves adding tracking codes to your web pages. Tools like Google Tag Manager can simplify this process, allowing you to manage tracking codes without altering the website code directly.
For SharePoint, CardioLog Analytics offers seamless integration, making it easier to track user behavior within your SharePoint environment. The platform provides out-of-the-box tracking for various SharePoint elements, including pages, documents, and social interactions.
4. Collect Qualitative Data
In addition to quantitative data, collecting qualitative data can provide deeper insights into user behavior. Methods for collecting qualitative data include:
- User Surveys: Ask users for feedback on their experience and any issues they encountered.
- Session Recordings: Record user sessions to see how they interact with your site.
- Heatmaps: Visualize where users click, scroll, and hover on your pages.

Analyzing User Behavior Data
Once you have collected user behavior data, the next step is to analyze it to extract meaningful insights. Here’s how to go about it:
1. Segment Your Audience
Segmenting your audience allows you to analyze behavior patterns among different groups of users. Common segmentation criteria include:
- Demographics: Age, gender, location, etc.
- Behavior: New vs. returning visitors, frequency of visits, etc.
- Source: Traffic sources, such as search engines, social media, or direct visits.
Segmentation helps you understand how different user groups interact with your site and tailor your strategies accordingly.
2. Identify Patterns and Trends
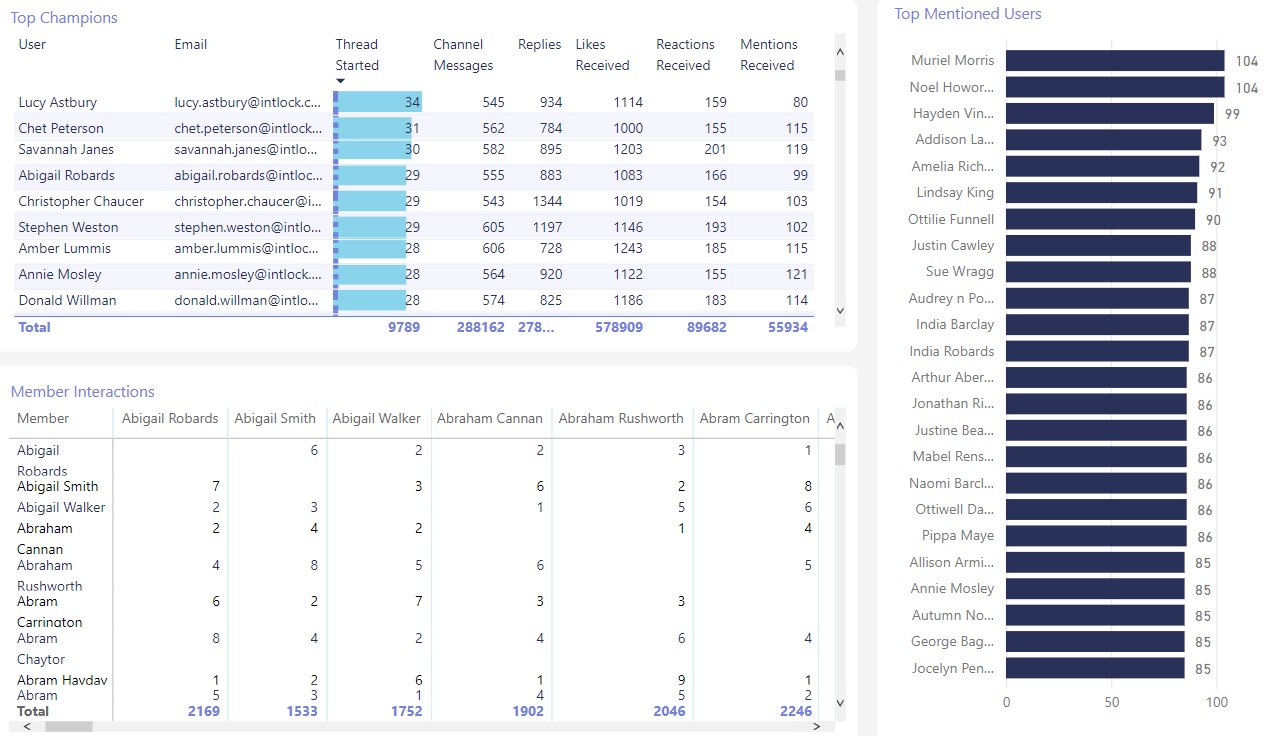
Look for patterns and trends in your data to understand how users navigate your site. For example, you might discover that users frequently abandon the site on a particular page, indicating a potential issue that needs to be addressed. Tools like CardioLog Analytics provide advanced reporting features, allowing you to visualize and analyze user behavior data effectively.
3. Use Funnel Analysis
Funnel analysis is a powerful technique for understanding the user journey and identifying drop-off points. By analyzing how users move through different stages of a conversion funnel, you can pinpoint where they are losing interest or encountering difficulties. This insight can help you optimize the user journey and increase conversion rates.
4. Conduct A/B Testing
A/B testing involves comparing two versions of a page or element to see which performs better. By testing different variations, you can determine which changes lead to improved user engagement and conversions. For example, you might test different headlines, call-to-action buttons, or page layouts to see which version resonates more with your audience.
5. Leverage Machine Learning
Machine learning algorithms can analyze vast amounts of data and uncover patterns that might not be immediately apparent. These algorithms can predict user behavior, segment audiences, and even personalize content based on individual preferences. Incorporating machine learning into your analysis process can provide deeper insights and drive more effective strategies.
Practical Tips for Effective Data Analysis
To get the most out of your user behavior data, follow these practical tips:
- Ensure Data Accuracy: Regularly audit your data collection processes to ensure accuracy and consistency.
- Focus on Actionable Insights: Identify insights that can lead to tangible improvements and prioritize those.
- Combine Data Sources: Integrate data from multiple sources to get a comprehensive view of user behavior.
- Keep Up with Trends: Stay updated on the latest trends and best practices in data analysis to continuously refine your strategies.
- Collaborate Across Teams: Encourage collaboration between marketing, UX, and development teams to leverage insights effectively.
Use Case: SharePoint and CardioLog Analytics
Let’s explore a practical example of using CardioLog Analytics to collect and analyze user behavior data within a SharePoint environment.
Scenario: Improving Employee Engagement on an Intranet Portal
A large organization uses SharePoint as its intranet portal and wants to improve employee engagement. They implement CardioLog Analytics to track user behavior and identify areas for improvement.
Step 1: Setting Up Tracking CardioLog Analytics is integrated with SharePoint, enabling comprehensive tracking of user interactions with pages, documents, and social features.
Step 2: Defining Goals and KPIs The organization sets goals to increase page views, reduce bounce rates, and improve session duration. KPIs are defined to measure these objectives.
Step 3: Analyzing Data Using CardioLog Analytics, the organization segments its audience based on departments and job roles. They discover that certain departments have higher engagement rates, while others show low interaction.
Step 4: Identifying Issues Funnel analysis reveals that users often drop off when accessing training materials. Further investigation through heatmaps and session recordings shows that the training section is difficult to navigate.
Step 5: Implementing Changes Based on these insights, the organization redesigns the training section to be more user-friendly and prominently features popular resources.
Step 6: Measuring Impact After implementing changes, the organization continues to monitor user behavior. They observe increased page views and longer session durations, indicating improved engagement.
Conclusion
Collecting and analyzing user behavior data is essential for optimizing websites and enhancing user experiences. By using tools like SharePoint and CardioLog Analytics, organizations can gain deep insights into user behavior and make data-driven decisions to drive business growth. Remember to define clear goals, use a combination of qualitative and quantitative data, and continuously refine your strategies based on the insights you uncover. With the right approach, you can unlock the full potential of user behavior data and achieve significant improvements in engagement, retention, and overall performance.


 Follow @cardiolog