KNOW YOUR SITE AND CUSTOMERS
Portal/Web analytics SharePoint tools help you boost the sales of your portal/web-based business and increase visitor satisfaction. They enable you to gain a deep insight into your online customers and to know how well your portal/website is performing.
The SharePoint Marketing Suite provides a huge variety of usage reports for SharePoint Interne and intranet sites. Whether you need basic stats, custom dashboards or executive reports we have it all. With our friendly reporting interface, you can use our analytics SharePoint tools to easily create, filter, segment, schedule, export and publish reports all at the click of a button. And with our real-time SharePoint portal/web analytics reports, you can view information within minutes of it occurring on your website.
Our SharePoint portal/web analytics tools integrate seamlessly with SharePoint giving you the power to get to know your customers and improve your business.
- Benefit from fast deployment
- Create executive analytics dashboards
- Identify bottlenecks on your site
- Gain complete control over your site’s structure
- Get notified of significant changes in your site’s usage
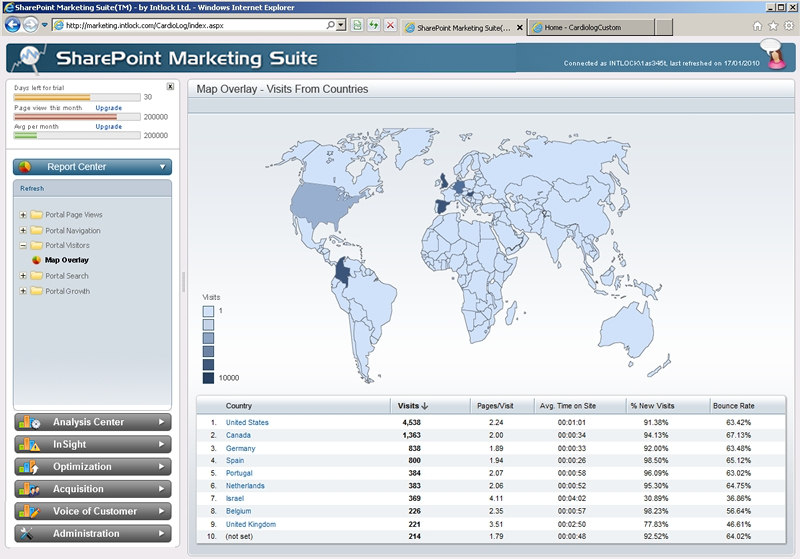 Map overlay report | 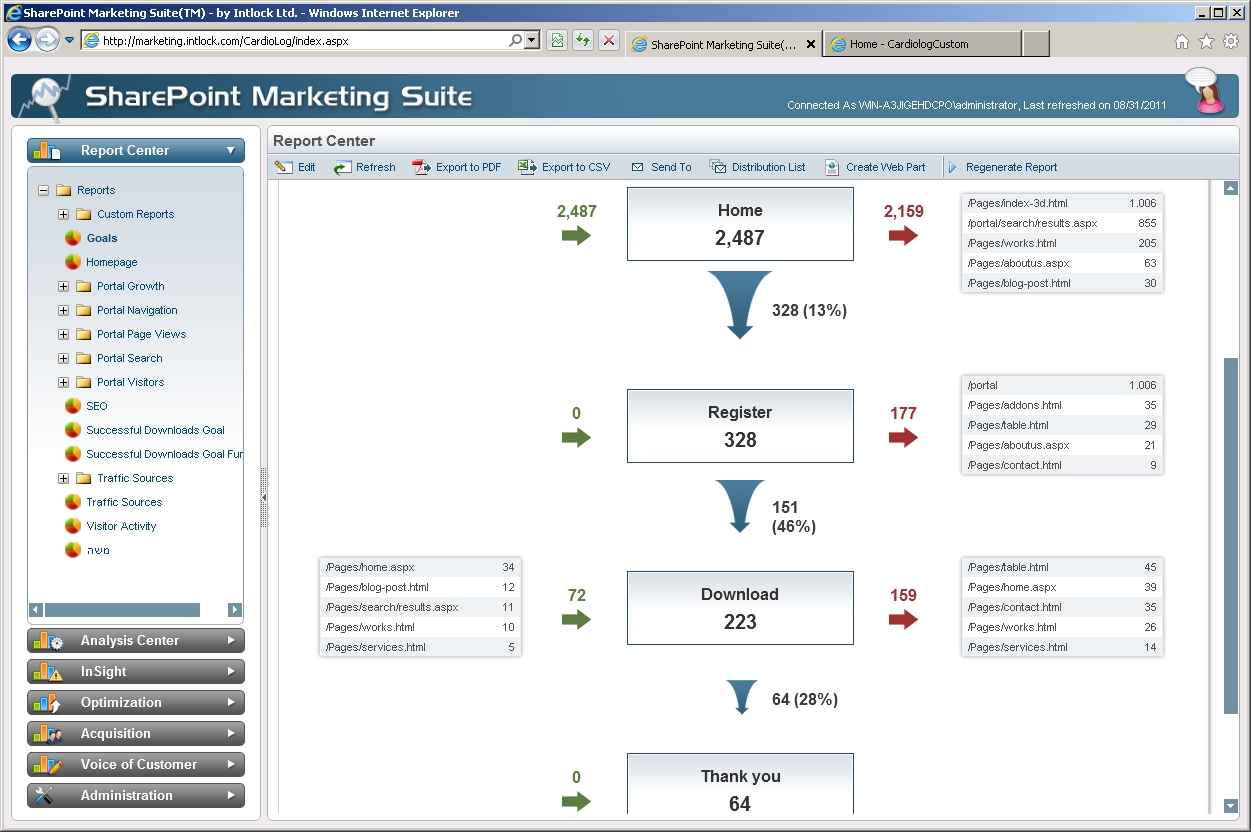 Goal funnel report |
You can use Intlock’s SharePoint portal/web analytics to see visit information within minutes of a customer’s click on your website for a real-time insight into your business and the impact of new content, campaigns or events. The invaluable, real-time information provided by the portal/web analytics SharePoint tools means you’ll know instantly what’s working best for your business. What’s more, you can instantly segment the real-time data using web analytics SharePoint tools, and turn it into intelligent, flexible graphs that will help you share insights with stakeholders.
SharePoint analytics has dozens of metrics including visitors, visits, referrers, search actions and top pages that help you build up a complete picture of your visitors’ behavior. Our analytics SharePoint tools equip you with this powerful and multi-faceted information, which ultimately helps you get to know who your potential customers are and what they want. With Intlock’s SharePoint analytics you can create custom reports that help improve your marketing strategy and give visitors the optimum online experience. The analytics SharePoint tool has sophisticated segmentation capabilities to help you analyze multiple time periods and online sessions.
Our analytics SharePoint tools arm you with essential insight. SharePoint analytics can easily customize your executive dashboard to give snapshots of the key performance indicators, benchmarks, and charts that will help you monitor your business. The personalized dashboard, coupled with visitor demographics reports, offer a valuable picture of the age and sex of your customers, helping you to better know your audience and enabling you to move from SharePoint analytics to action, by better aligning your marketing campaign or finding high-performing audiences in new channels.
You can also identify buying patterns and promote profitable products with SharePoint web analytics. Our analytics SharePoint tools include merchandise reporting that tracks your most successful products and product combinations. The ability to segment in an ad-hoc manner with analytics SharePoint tools also helps reduce the costs of marketing by making sure the most relevant message gets to the right customer via the best channel. The power that our web analytics SharePoint tools put in your hands is invaluable to your business.
In addition, the customizable reports that are among the web analytics SharePoint tools make report management quicker and easier. With SharePoint analytics, you can schedule reports to be delivered regularly by email, and the comprehensive set of ready-to-use SharePoint analytics reports can be exported to Excel, PDF, PPT and XML formats. SharePoint web analytics reports also have several levels of user access.
Key Features
- Dozens of web analytics metrics, including visitors, visits, referrers, search actions, top pages, and many more.
- Custom events for tracking various activities such as document downloads, video player interactions, form submission, etc.
- Activity breakdown by hour, day, week, month, quarter, year
- Customizable dashboards and reports
- Data Export and developer API integrate business information and develop applications which access your web analytics data.
- Report permissions and access rules (AD based)
- Raw and real-time data collection
- Report scheduling and emailing
- Export reports to Excel, PDF, PPT, and XML
- Web parts – add widgets to share your web stats
- As an on-premise solution, you own your web analytics data
- Multilingual interface
- A holistic view of all of your site properties support multiple sites and multiple farms
Goals and Funnels
- Centralized goals and funnels management
- Unlimited number of funnels and goals
- Goal measurement by visits and visitors
Advanced tracking module
- AJAX, Flash, and Silverlight
- Server-side event tracking
- Video analytics
- Outbound links
- Downloadable content
- Automatic tracking code installation
Portal/web Analytic Reports
SharePoint Marketing Suite includes numerous reports specially designed for intranet/internet facing SharePoint websites:
Page Views
- Average Page Views by Day of the Week
- Inactive Sites
- Page Views by Page Type
- Page Views by URL
- Page Views
- Peak Hours
- Recently Viewed
- Top Web Parts
- Views Audit Log
Visitors
- Active User Categories
- Anonymous vs. Authenticated Users
- Average Number of Visitors
- Average Page Views per Visitor
- Average Page Views per Visit
- Average Visit Duration (time on site)
- Average Visits per Visitor
- Bounce Rate
- Browsers
- Depth of Visit
- Inactive Users
- Visitor Activity
- Visitor Profile
- Languages
- Length of Visit
- Loyalty
- Map Overlay
- New Visitors
- New vs. Returning Visitors
- OS
- Recency
- Returning Visitors
- Unique Visitors By URL
- Unique Visitors
- User Groups
- Visits Audit Log
- Visits
- Who is Online
Goals
- AB Test Goal Conversion
- Conversion Rate
- Converted Users
- Goal Funnel
- Goal Summary
- Goal Value
- Multi-Variate Test Goal Conversion
- Total Conversions
Traffic Sources
- Campaigns
- Search Phrases
- Referring Pages
- Search Engines
- Referring Sites
- Traffic Sources
Navigation
- Average Time to Page
- Entrance Paths
- Exit Pages
- External Destinations
- Internal Traffic Sources
- Landing Pages
- Navigation Summary
- Next Pages
- Previous Pages
SEO
- Average Page Load Time
- Content Not Found
- Duplicate Descriptions
- Duplicate Titles
- Status Codes
- Pages with Broken Links
- Slow Pages
- Violations
- Changed Pages (period comparison)
- Duplicate Content
- External Links
- Fixed Violations in Existing Pages (period comparison)
- Large Content
- Link Depth
- Most Linked Pages
- New Pages (period comparison)
- New Violations in Existing Pages (period comparison)
- Pages with Less Links (period comparison)
- Pages that Became Faster (period comparison)
- Pages that Became Larger (period comparison)
- Pages that Became Slower (period comparison)
- Pages that Became Smaller (period comparison)
- Pages with More Links (period comparison)
- Pages with a Different Status Code (period comparison)
- Pages with Most Links
- Removed Pages (period comparison)
- Violations in New Pages (period comparison)
Surveys
- Survey Responses
Tip: SharePoint Message Bars might also interest you