

Understand who uses your SharePoint portal and how they engage
A busy SharePoint portal does not necessarily mean employees are finding what they need. Page views show that content was opened, but adoption, engagement, and navigation reports add context to those numbers.
CardioLog Analytics SaaS helps site owners and communications teams understand which users access SharePoint, how activity varies, and which paths visitors follow. Use these insights to investigate adoption gaps, improve content visibility, and make information easier to reach.
The SharePoint reports bring together usage data with available content and user metadata. Profile details and filtering options depend on the information configured in your environment.
Identify active and inactive users
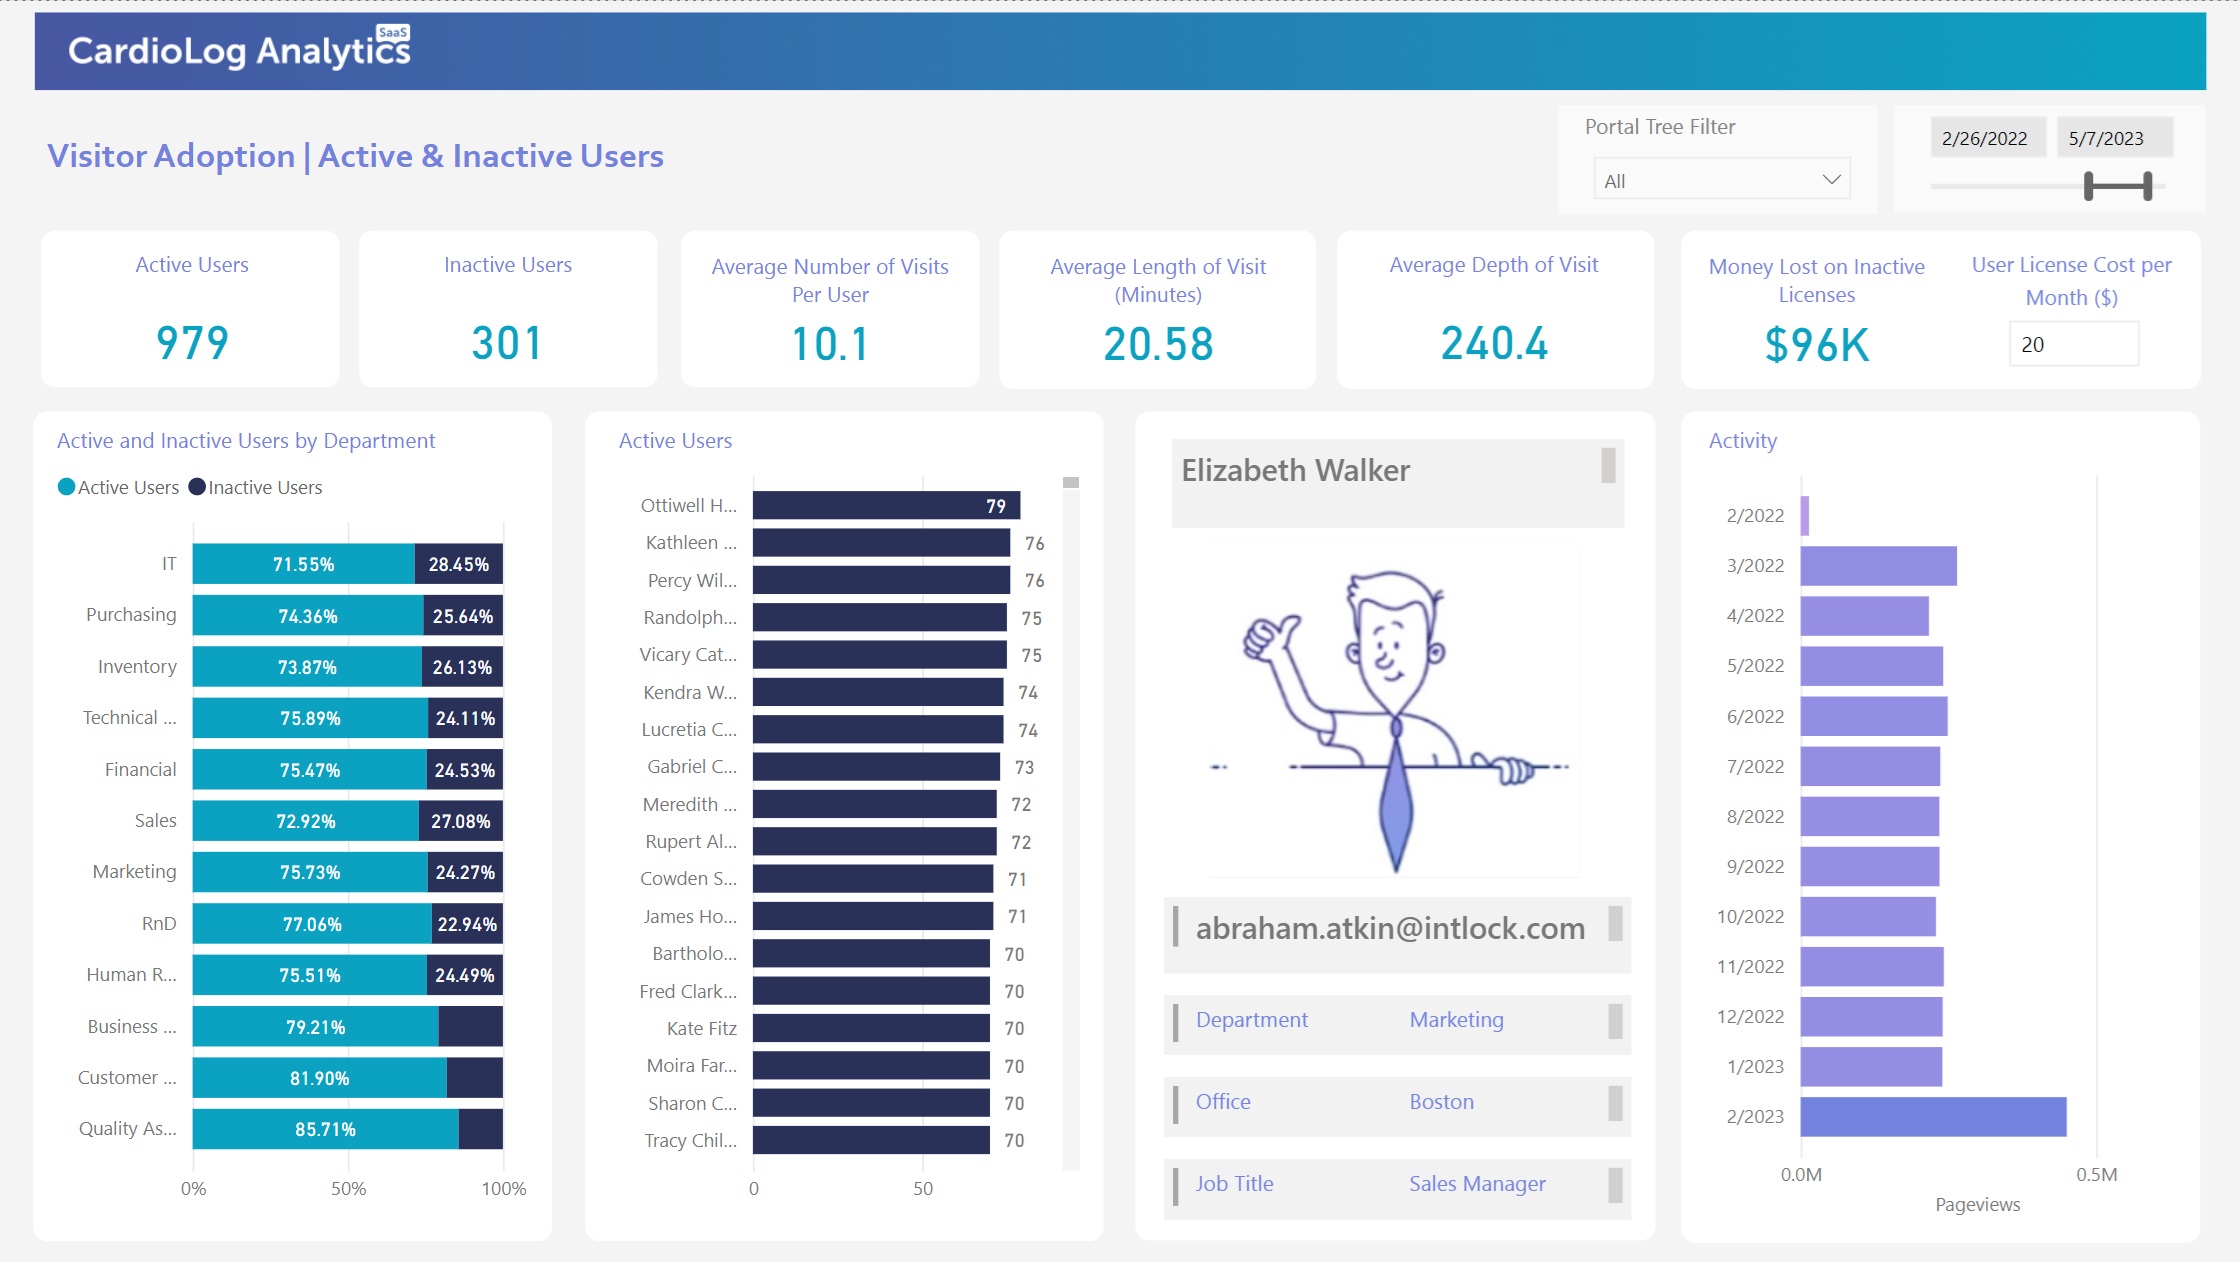
The Visitor Adoption | Active & Inactive Users report shows which known users accessed your site during a selected period and which did not. It includes active and inactive user counts, visits per user, visit duration, and visit depth.
A department breakdown helps you see where adoption differs. The report also lists active users by number of visits and provides a summary of a selected user’s profile information.
Use this view to identify groups that may need clearer communication, better access to relevant content, or additional training. Inactivity is a starting point for investigation; it does not explain why a person has not visited.
For example, if one department has fewer active users than expected, review whether its employees know where to find the information relevant to their work.
Understand adoption and repeat visits
The Visitor Adoption | Overview report adds measures such as new visitor rate, active user rate, average visits per user, and new versus returning visitors.
Its date and Portal Tree filters let you focus on a selected period or part of your portal. Review whether a new site attracts first-time visitors and whether people return after its launch.
Compare results across relevant periods, while accounting for holidays, communications activity, and changes in the audience.
Explore visitor engagement
The Visitor Engagement | Overview report helps you examine how people use the portal during visits. It includes visit depth, visit length, searches per visit, visitor recency, and visitor frequency.
These measures help you investigate different patterns of use. A short visit could mean someone found the information quickly, while a longer visit could reflect useful exploration or difficulty finding an answer. Interpret the metrics alongside the content and navigation experience.
Use the report to identify patterns worth examining rather than treating time spent or pages viewed as a direct measure of success.
See when and where activity occurs
The Visitor Engagement | Activity Distribution report shows page views, visits, and active users, together with activity by date, day of the week, and hour.
It also includes a geographic breakdown of page views, with drill-down from continent to city where location data is available.
These views can help communications teams understand when employees access content and how activity differs across locations. Use that information when reviewing publication schedules or investigating whether regional audiences are engaging with relevant material.

Follow visitor navigation paths
The Navigation | Visitor Journey report visualizes the routes users take through your portal. Expand a page in the decomposition tree to see the next steps visitors followed.
The documented journey is a browser session containing page views and external-link clicks, with a maximum of seven steps. It is not a complete record of every type of interaction.
Filter by landing page, date, user name, department, office, or country to focus on a relevant audience. Use the results to investigate whether important information is easy to reach and where navigation could be clearer.

Turn visitor insights into practical improvements
Start with a specific question: who is not accessing a site, when is content being viewed, or how do visitors reach an important page?
Choose the relevant CardioLog Analytics SaaS report, set a consistent reporting period, and review the available filters. Use the findings to prioritize content updates, navigation improvements, and targeted support, then review activity after the changes.