Your intranet portal or internet website puts masses of data at your fingertips – such as who’s using your site where, when, and why – but the key to success is in knowing how to use that data to make smart business decisions. That’s where CardioLog Analytics’ tools come in. Our analytics solution helps you keep pace with the digital world, enabling you to discover exactly what is, and what isn’t, working for your organization, by measuring and accurately interpreting your business data.
CardioLog Analytics custom dashboards are designed to help you navigate your way through this jungle of information. Our dashboards display summaries of your reports in the form of widgets on a single page, allowing you to monitor various metrics at once and giving you a true picture of what’s happening in your organization. You can easily select your own widgets for the dashboard so that you can track the most crucial metrics in an easy-to-understand way, communicate them powerfully to your employees and partners, and take action where it’s needed.
- display your most important metrics on a single page
- take a bird’s-eye view of your organization’s performance
- deliver customized dashboards to your employees and partners
- flexibly adapt your data display to changing needs
- easily set up and share your dashboards
- take action on the elements of your site that are letting you down
STAY FOCUSED
One of the greatest benefits of CardioLog Analytics dashboards is that they encourage you to focus on what’s really important to your organization. Setting up a dashboard requires you to think very carefully about what information you want to see there, and what is less crucial; to think about what your priorities are, and how you’ll know whether you’re fulfilling your business goals. Then, CardioLog enables you to collect your portal or website’s most meaningful measurements in one, purposeful, accessible page – cutting through a mass of data to the information that really matters.
Your CardioLog dashboard can feature user-friendly charts and graphs, but it can also include details of recommended courses of action. It’s not necessary to leave it to your employees and partners to gather their own conclusions from the data – your dashboard can also incorporate written comments by your analysts, offering their words of wisdom on the stats and making your dashboard all the more relevant and useful.
GET SOME PERSPECTIVE
In addition to helping you focus on your business priorities, CardioLog Analytics dashboards also allow you to take a bird’s-eye view of your portal or website if you wish. There’s no need to present a metric in a vacuum: You can display your data in comparison to a certain goal; or compare the performance of different channels, different periods of time, or different visitor segments, for example. Providing this context makes your CardioLog dashboard entirely actionable, enabling you to see at a glance what are the contributing factors to a good, or bad, performance. Each widget on your dashboard also represents an underlying report, and you can click on the widget to drill down into that report for more detailed information.
CUSTOMIZE YOUR CONTENT
There’s no such thing as a perfect dashboard that meets everyone’s needs. If you share one dashboard across several teams, each group with special interests will start asking for more than is shown on the dashboard. That’s why with CardioLog Analytics it’s possible to create an unlimited number of dashboards, customizing them according to the different demands and interests of your various employees and partners, and filtering them to show only the most pertinent data. You could create one dashboard with relevant performance indicators for your sales team, and another that offers your CEO a broader outlook – giving each person the tools they need to make informed decisions.
ADAPT TO THE CLIMATE
CardioLog Analytics dashboards are also incredibly flexible, adapting to the changing needs of your organization. Everything changes – new and important priorities emerge, employees come and go, competitors invent smart new solutions – so it’s natural that your metrics will change, and your dashboard should follow suit. One simple example of the adaptability of CardioLog’s dashboards is that you can adjust the date ranges that appear for a quick spot check of different time periods without having to open the full report or enter the dashboard editor. Within the dashboard editor, it’s easy to add or remove widgets, and you can also change the appearance, filters, and segments you’re focusing on – either for the entire dashboard or for individual widgets.
HOW TO CREATE A DASHBOARD
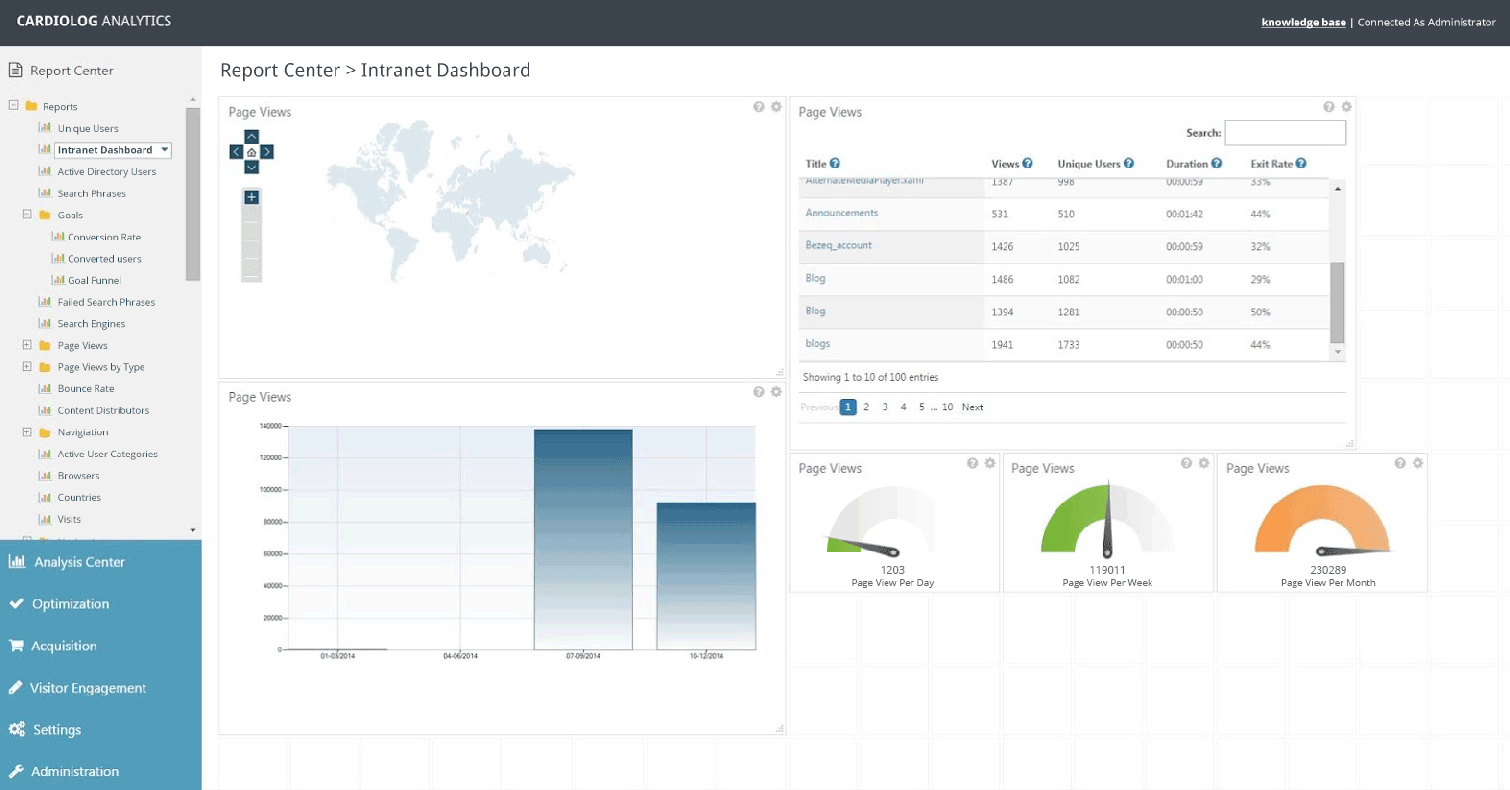
Creating a CardioLog Analytics dashboard is relatively easy. The Report Center already displays sample dashboards and, in the Analysis Center, a single click on any tree item displays a default dashboard that already contains a few widgets. It’s possible to add new dashboards by clicking “Add report” in the Report Center and to add new widgets at the top of any report by clicking “Add widget” from the dashboard menu. You can then choose the date range, the content you want to appear in the widget, and whether it should be displayed in a meter, a graph, a table or both. It’s possible to apply segmentation to individual widgets or the entire dashboard. You can create an unlimited number of dashboards, and each dashboard can contain an unlimited number of widgets.
With CardioLog, it’s possible to customize or remove any widget on a dashboard, even the ones included by default as sample reports and report templates. You can click on the “Report actions” button that appears in the top corner of each widget to see the customization options. You can also set permission for your employees and partners to view and/or edit a certain dashboard.
HOW TO SHARE A DASHBOARD
Once you have created your CardioLog Analytics dashboard, you can share it with other employees and partners in your organization. To share a dashboard, click on the dashboards menu, and select one of the following sharing options: send the report via email, create an automatic email distribution list, export to Excel, export to PDF, or export to web part (to display the report in SharePoint).