InSight for SharePoint is a web analytics tool, which seamlessly provides key information for business owners and professional analysts. It helps identify your portal’s goals and objectives, monitors significant usage events which may affect your portal goals, and provides possible causes for the changes in data. By receiving notifications, analysts and decision-makers can uncover key performance indicators (KPI) they may have otherwise missed and can focus on taking action instead of sifting through data.
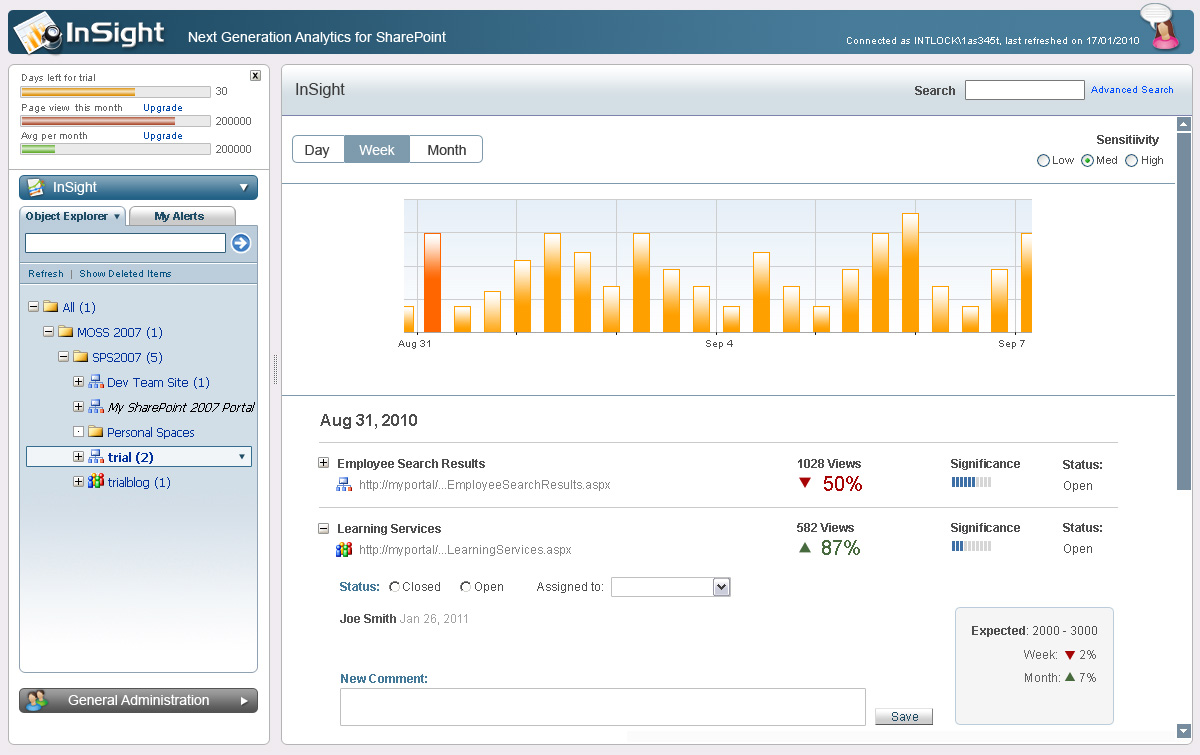
Behind InSight is a sophisticated decision-making engine, which detects any anomalies in the portal’s traffic patterns. For example, if the number of portal visits suddenly decreases for a specific subsite, InSight will automatically notify the owner, adding a visual alert to the InSight dashboard. In other cases, InSight can call out a 250% surge in visits to the portal’s news site, or let you know that bounce rates of visitors to the homepage dropped by 80% two weeks ago. Instead of analysts and business owners having to monitor reports and comb through data, InSight notifies them regarding the most significant information and trends which can potentially affect their business.


InSight’s Dashboard

InSight’s dashboard includes various reports for different time scales. In addition to the out-of-the-box automatic alerts, users can define their own dimensions and metrics that will be monitored by InSight.
InSight for SharePoint monitors changes in multiple web analytic metrics, which are segmented according to portal scopes (sites and pages within the portal tree), and according to various visitor segments (such as AD groups and custom visitor categories). The segmented metrics are then analyzed over time in order to detect daily, weekly and monthly trends – based on portal history data or predefined threshold values.
InSight is a standalone web analytics solution. It is used primarily to identify and analyze significant changes in your portal usage patterns, however, it does not provide the capability to create and run web analytic reports for your portal. InSight can be integrated with CardioLog Analytics in order to provide both next-generation analysis and traditional data reports. When integrated with CardioLog Analytics, the InSight dashboard is displayed within the CardioLog Analytics interface. InSight can utilize many of the CardioLog Analytics modules and features: system roles, permissions, real-time analysis, localization, custom visitor segments, and more.
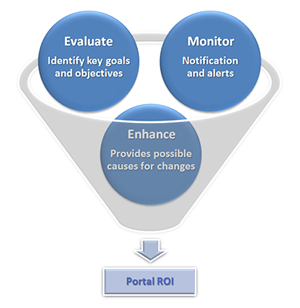
InSight includes three main building blocks:
- Evaluate: identify the portal’s key objectives and goals
- Monitor: supervise metrics for measuring the portal’s goals
- Enhance: provide insight into possible causes for changes in goal metrics

A. Evaluating and Identifying Portal Goals
InSight enables you to define Portal Goals by using the Portal Goals Wizard, an easy-to-define process for identifying business objectives, goals, and metrics. Portal Goals are KPIs aligned with specific portal business objectives, which trigger unique custom alerts.
With the Portal Goals Wizard, you first define the top business priorities for your portal, such as collaboration, news & info, business processes, enterprise search, content management, governance, and personal workspace. Then, the Wizard helps identify the strategies you leverage to accomplish your portal business objectives. For example, if the top priority for your SharePoint portal is Collaboration, you might leverage the following strategies:
- Creating active team and meeting sites
- Creating active task and issues lists
- Page and item sharing between employees
- Engaging all site users in collaborative activity
- Creating employee blogs
- Running surveys
- Offering page tagging and notes
Or, if you have a News & Info portal you might be using the following strategies to meet your portal business objectives:
- Ongoing publication of articles
- Ensuring that articles are discoverable
- Ensuring that articles are reviewed
- Increasing articles lifetime (relevancy)
- Ensuring the circulation of popular articles
- Ensuring a gradual increase in the number of published articles
- Minimizing time from article creation to consumption
- Increasing the percentage of returning visitors
In the final steps, the Portal Goals Wizard will suggest metrics for measuring your portal goals and strategies. These metrics are then added to the InSight framework for ongoing monitoring, reporting, and notifications.
InSight Metrics
In addition to common web analytics metrics, InSight also introduces new portal related metrics. These metrics are used as the basis for monitoring KPIs in relation to portal goals. Here are some examples of InSight’s standard and portal metrics:
- Viewed pages: number/top viewed pages
- Unviewed pages: number of unviewed pages
- Page lifetime: average duration (in days) for which pages are viewed
- Time from creation to consumption: average time it takes from publishing to viewing
- Page update rate: average number of page updates
- Visitors: number/top unique visitors
- Skimmers: number of unique visitors who skimmed through content pages (articles)
- Bouncers: number of unique visitors who did not read through content pages (articles)
- New visitors: number of first-time visitors
- Returning visitors: number of returning visitors
- Bounce Rate: the percentage of page views with a view duration of under 5 seconds
- Page view duration: average page view duration
- Visits per user: average number of visits per user
- Time on site: average session duration
- New pages: number of added pages (articles)
- Contributors: number/top content owners
- Modifiers: number/top content modifiers
- Sites/Lists: top sites and lists
- Unused sites/lists: number of unused sites and lists
- Private pages: number of pages visited only by page owner
- Unique visitors: number/top users
- Posts: number/top blog posts
- Comments: number/top blog comments
- Mobile users: number/top mobile users
- Document access form office apps: number/top documents
- Personal spaces: number/top personal spaces (my site)
- Used personal spaces: number/top used personal spaces
- Unused personal spaces: number of unused personal spaces
- Search rate: percentage of visits with search
- Successful searches: number of successful searches
- Failed searches: number of failed searches
- Searchers: number/top users who searched the portal
- Satisfied searchers: number/top satisfied searchers
- Search refinements: percentage of searches with refinement
- Search phrases: number/top search phrases
- Search results: top search results
- Search origin pages: number/top search origin pages
- Search destination pages: number/top search destination pages
- Viewed documents: number/top viewed documents
- Unviewed documents: number of unviewed documents
- Modified documents: number/top modified documents
- Unmodified documents: number of unmodified documents
- Document viewers: number/top document viewers
- Document contributors: number/top document contributors
- New document contributors: number of first-time document contributors
- Document modifiers: number of document modifiers
- New document modifiers: number of first-time document modifiers
- Private documents: number of documents visited only by document owner
- Public documents: number/top documents visited by more than 1 user
- Completed workflows: number/top completed workflows
- Pending workflows: number/top pending workflows
- Time to fill out InfoPath form: average time for filling out InfoPath forms
- Workflow steps: average number of workflow steps
- InfoPath forms: number/top InfoPath forms
- Form submissions: number/top form submissions
B. Monitoring and Notifications
InSight for business portals includes two types of notifications: default (automatic) and custom. Users can define the notification sensitivity, which controls the number of automatic notifications that will appear in the InSight dashboard.
Default notifications show interesting trends in the data based on advanced metrical algorithms. Custom notifications allow you to define the notification conditions based on specific metrics, dimensions, and portal goals.
Notifications are presented in both numeric values and comprehensible terms.
Sample alerts
- Alert: Article time on page [up 10%]
00:01:00 – the average time on page has increased by 10% during the past 30 days, and has reached the target of 60 seconds per page. - Alert: Article Views [down 7%]
22,000 page views – the number of article views has decreased by 7% from yesterday and has reached the lowest value in 2 years. - Alert: Homepage visits from EMEA [down 34%]
103,966 visits – the number of visits to the portal homepage by the EMEA user group has decreased by 34% in the past week. - Alert: Unviewed pages for Corporate Wiki [down 60%]
44 unviewed pages – the number of unviewed pages for Corporate Wiki has decreased by 60% from last month. - Alert: Article Lifetime [up 10%]
4.3 days – article lifetime has increased by 10% from last week but has not reached the target of 6 days.
C. Enhancing – Identifying Causes for Changes in Goal Metrics
In order to help drive actions based on analytic data, InSight offers a set of possible causes for changes in data. The suggested causes are based upon known usability cases and are also derived from cross analysis with other related metrics.
For example, when sending an alert for “The number of article views has decreased by 7% from last week”, InSight analyzes the possible causes for the reduction in the number page views. These causes can be derived from known usability facts, such as “Seasonal – end of quarter”, or by cross analyzing with other metrics. Here are some possible causes:
- Metric – The number of new articles is down 50% during the past week
- Metric – Article references from the portal homepage is down 20%
- Metric – Number of unique portal visitors is down 30%
- Metric – The number of returning visitors for the news site is down 30%
For a notification titled “The average time on page has increased by 10% during the past 30 days”, InSight might suggest the following possible causes:
- Metric – Direct traffic to the portal is up 25%
- Metric – Portal bounce rate is down 5%
- Metric – The number of new visitors is up 15%
- Metric – Top 10 article contributors has 3 new authors
- Usability – Compelling article titles
- Usability – Compelling article topics
- Usability – Pages include more content
- Usability – Pages include more rich media engagement
Key Benefits
- Helps identify portal goals and define appropriate usage metrics
- Provides automatic friendly notifications for significant changes in usage data
- Includes new and innovative portal-related metrics and reports
- Enables analysts and decision makers to focus on taking action instead of sifting through data
- Suggests possible causes for changes in data by cross-analyzing related sets of metrics
NEXT >> What Makes CardioLog Analytics Unique

Contact us for more information


