Power BI Microsoft Office 365 Introduction
CardioLog Analytics is an analytics tool specifically designed for use of Microsoft SharePoint portals- including intranet portals, extranet, and internet websites. The solution provides accurate and insightful information about SharePoint usage, based on the structure and content of the site.
The CardioLog Analytics tool already provides a multitude of predefined reports via its dedicated user interface. However, the integration with Microsoft Power Bi will enable stakeholders to perform quick, on-demand slice & dice actions of their data through additional intuitive reporting dashboards.
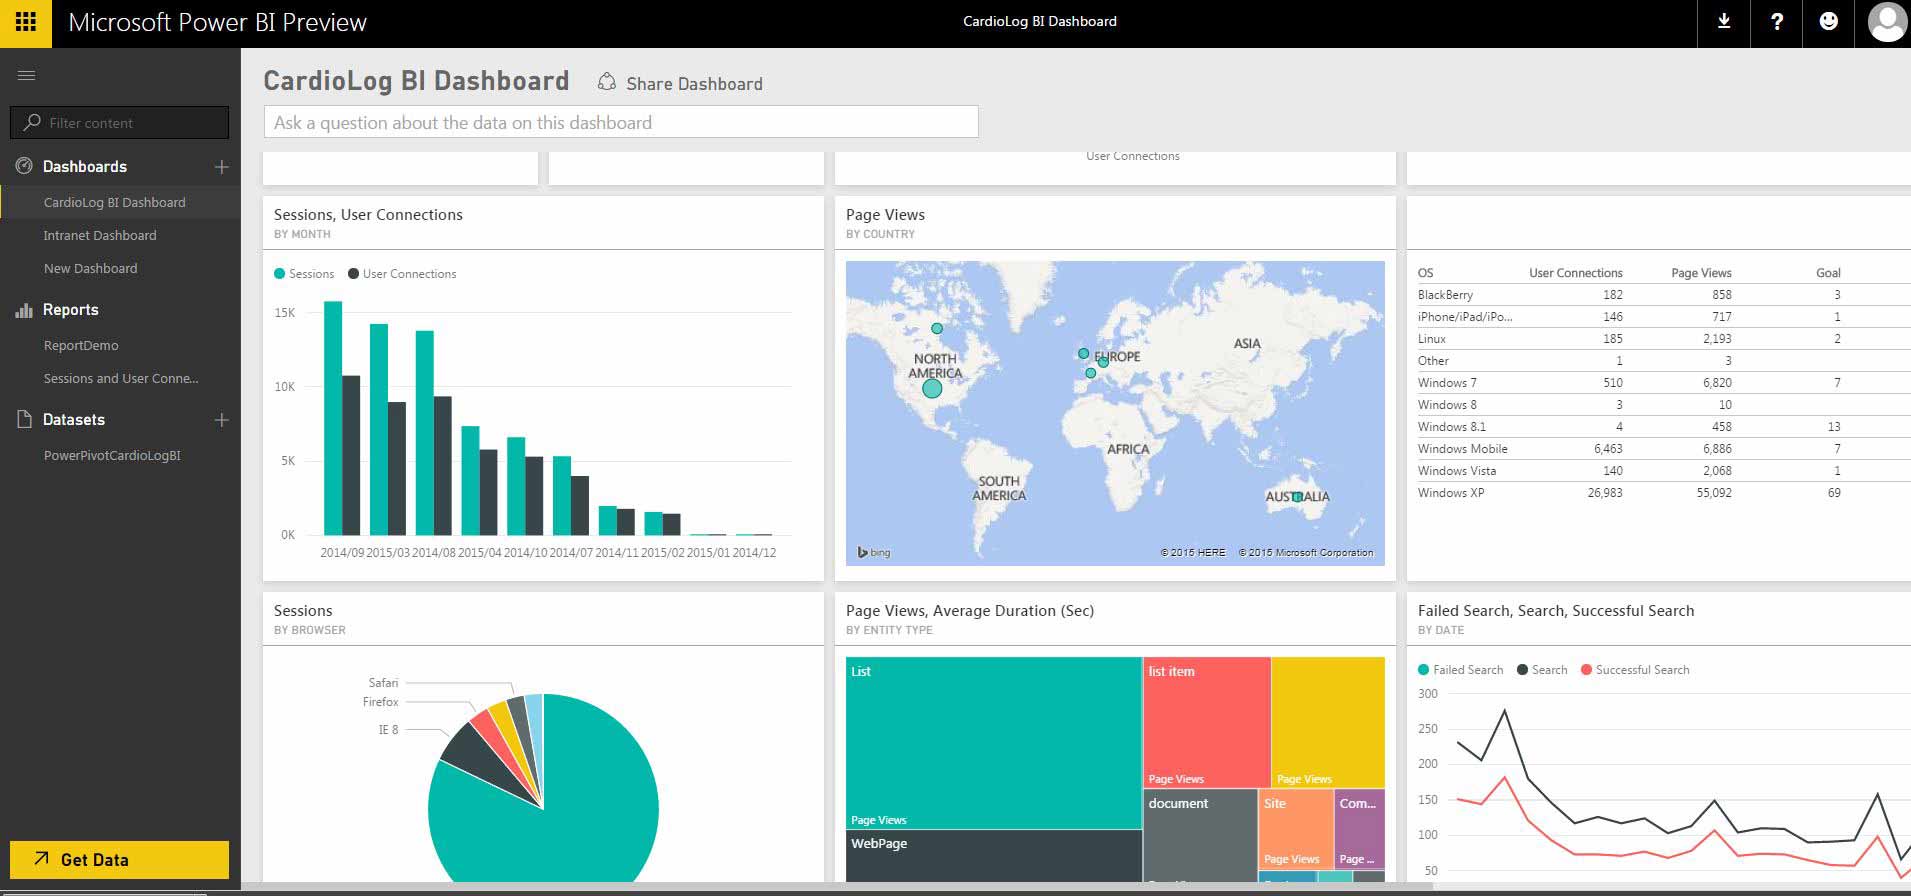
CardioLog Analytics’ integration with Microsoft Power BI provides sophisticated visualizations of live and interactive CardioLog dashboards and reports. This unique integration offers organizations the means for monitoring their SharePoint portal and business performance through the advanced looking glass of Power BI.
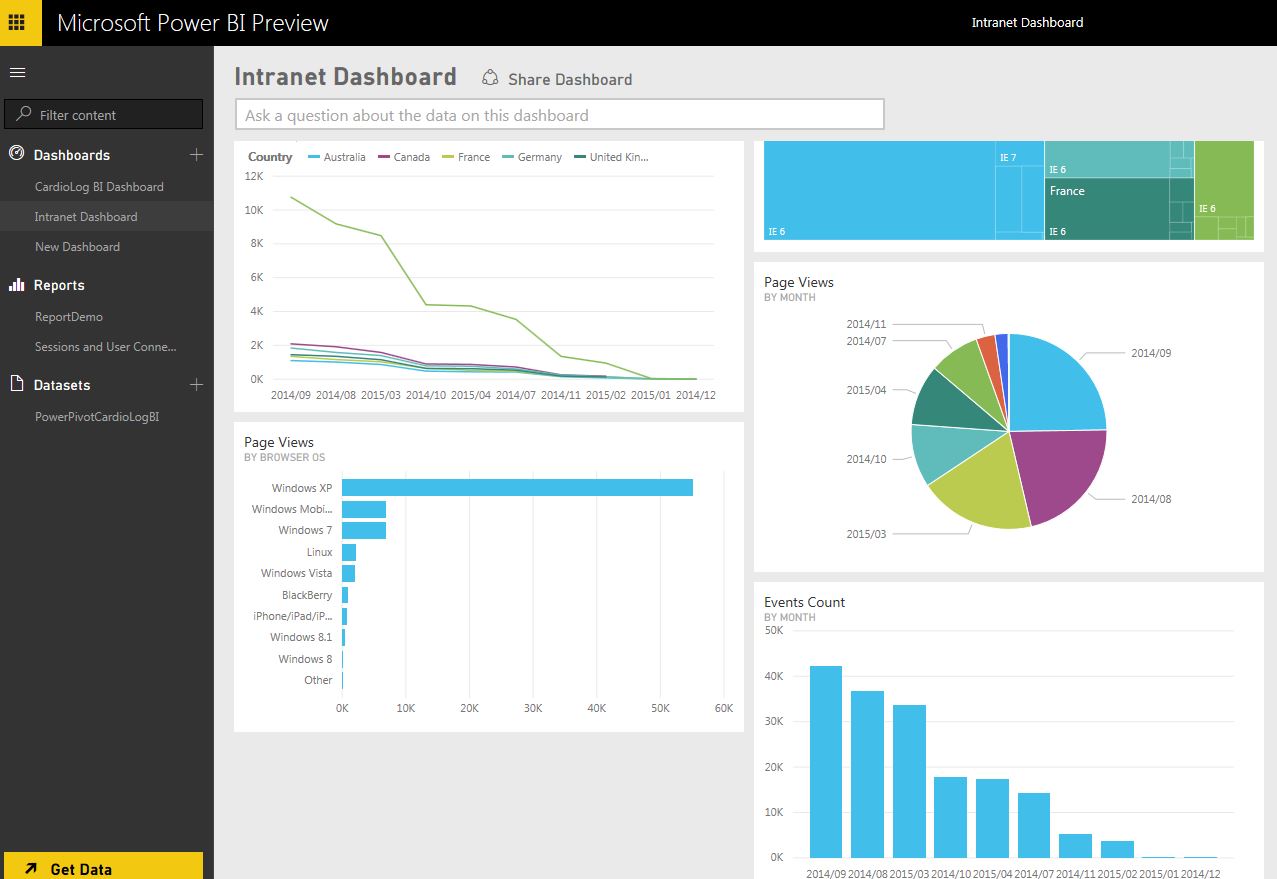
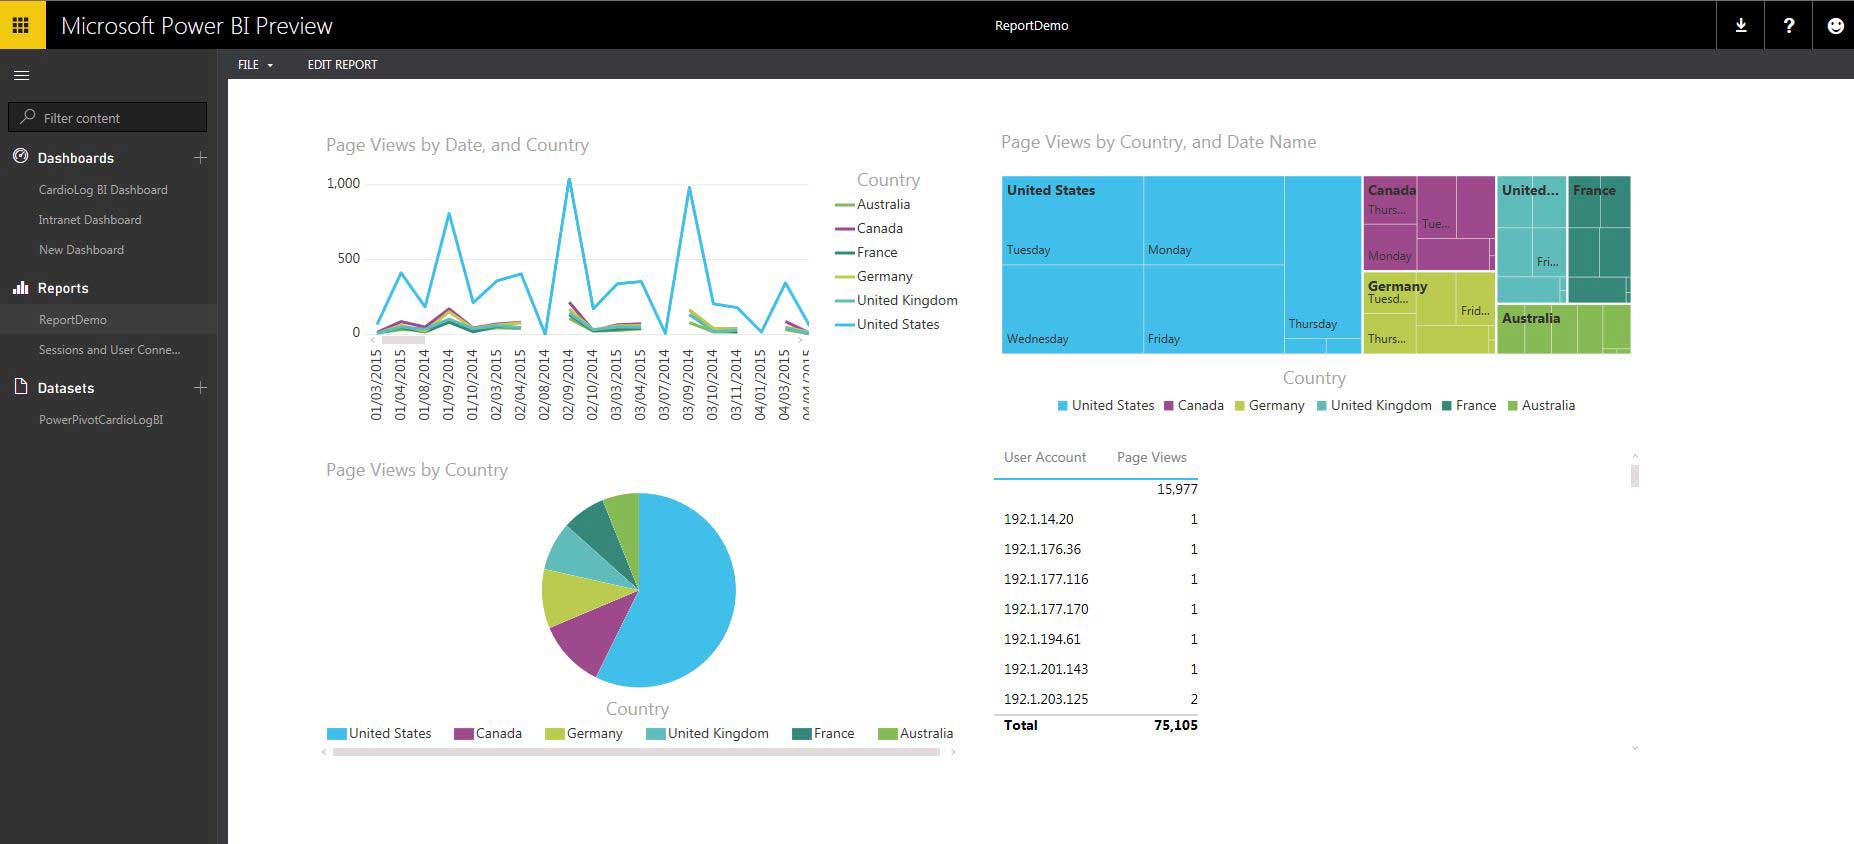
Stakeholders are able to create their own reports, filter relevant information, and slice and dice the data accordingly. By creating CardioLog’s dashboards with the Power BI Solution, enterprise organizations can gain a holistic view of business activity, and search through it all in one glance. These insights help them develop a course of action for monitoring and improving their SharePoint portal activity.
The integration of these two solutions results in accessible and easy-to-use dashboards, allowing for intuitive monitoring and analysis. Flexible and visually pleasing, the reports offer over dozens of different visualization options to suit organizational needs.
CardioLog Analytics- Power BI provides a “Self Service BI” solution, enabling users to analyze data gathered from any SharePoint edition, including SharePoint online (Microsoft Office 365), SharePoint 2013m 2010, 2007, and Social platforms such as Viva Engage (Yammer), Sitrion and more. The data is available for On-Premises, Hybrid, and Cloud-based deployments of Power BI.
The ability to effortlessly connect to CardioLog data is invaluable for monitoring the KPI that matters most whenever, wherever, and on any device.
With the CardioLog Analytics-Power BI integration, you can measure:
- Visitors
- Social (Viva Engage (Yammer) and Sitrion)
- Portal Growth
- Content
- Navigation
- Traffic Sources
- Onsite Search
- Goals
- SEO
- And more…
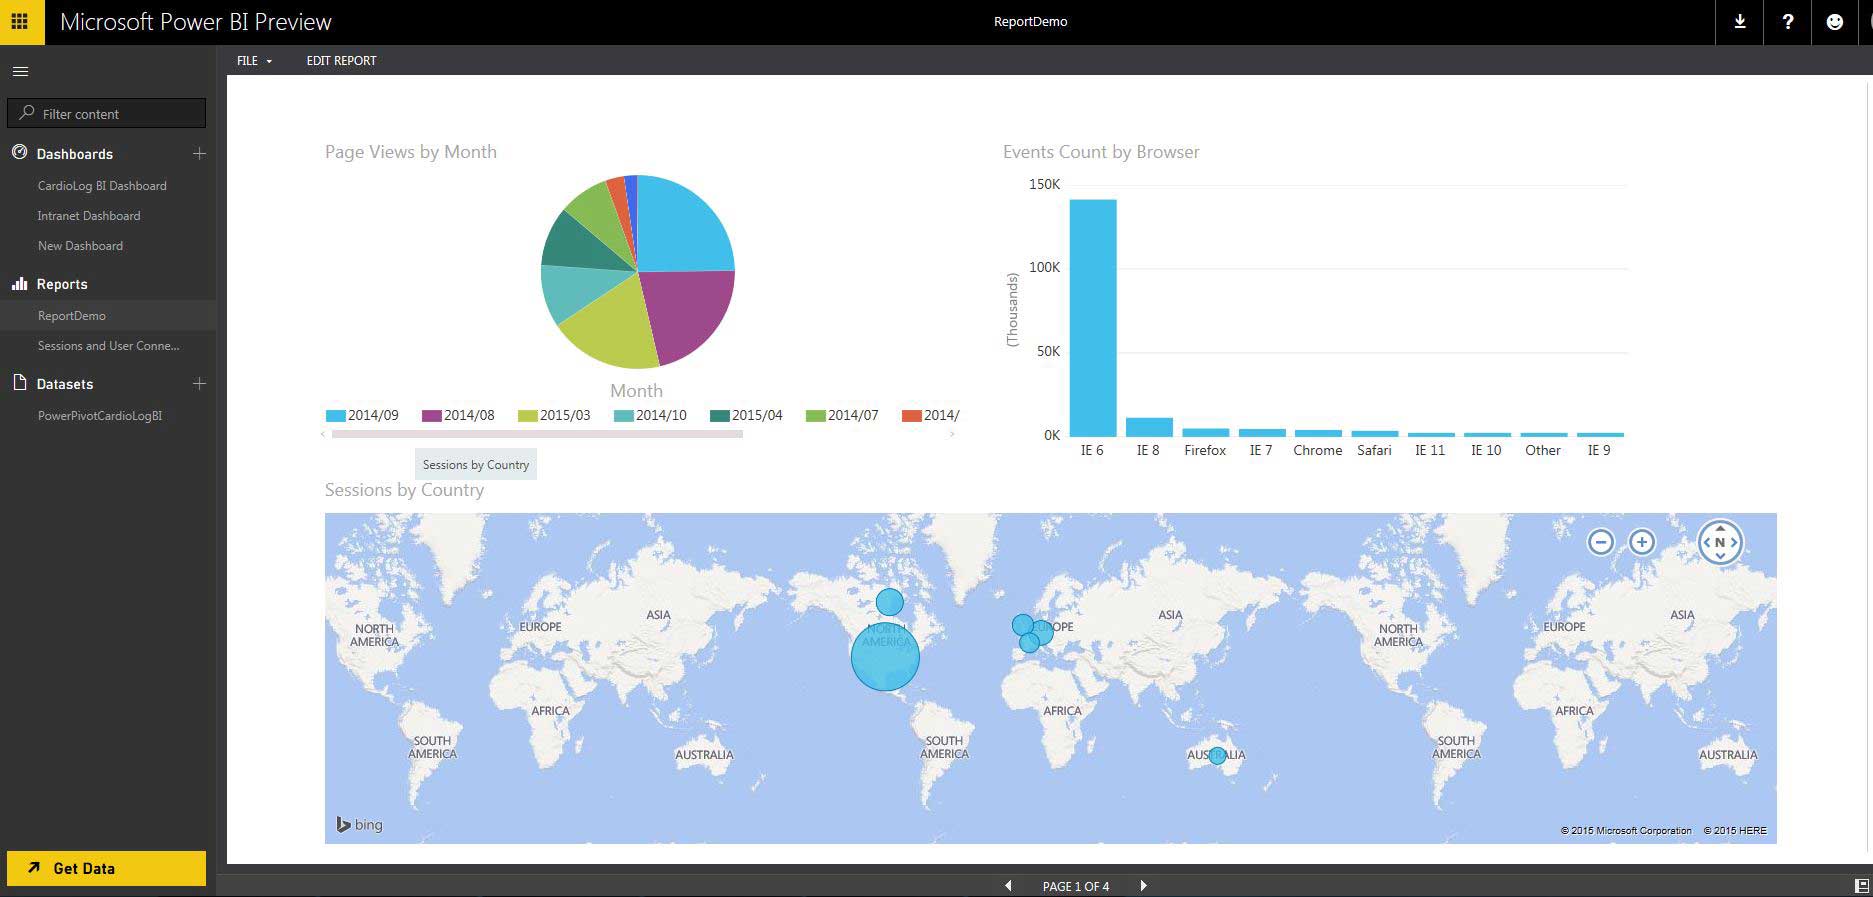
Take your report filtering options one step further with these filtering features. Filter by:
- Browser
- Operating System
- Countries
- And more…
Dimensioning
Enjoy the flexibility of additional dimensioning options for your CardioLog reports with Power BI. Each metric in CardioLog can be used as either a filter or a dimension. You can simply modify a column with just a drag and drop of the mouse, and voila! You can now customize your reports according to the dimensions you care about most.
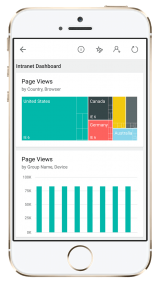
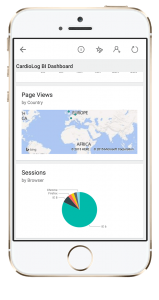
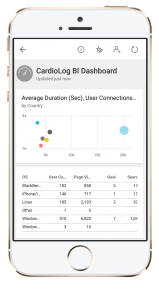
CardioLog Analytics for Power BI is seamlessly integrated for all mobile versions as well
Access your reports from any mobile device. Whenever, Wherever, and on the go!
Product Overview
CardioLog Analytics – Power BI is designed to work with Data Warehouse architecture. This type of topology allows customers to have some of their data remodeled according to DW’s best practices using an ETL (Extract, Transform, Load) process. On top of the DW architecture, the solution provides a tabular multidimensional model that enables fast and reliable aggregated queries and a semantic layer for the end users. The database layer which includes (Database, ETL and multidimensional model), can reside either on an On-Premises server or a hosted solution, with no effect on the process or architecture.
Microsoft Power BI Solution Scenarios
The Power BI solution can be offered in three main types of configurations:
- On-Premises Solution
- Excel services report – embedded in SharePoint.
These BI reports can be embedded within SharePoint. The reports and dashboards can be deployed to SharePoint as:
(i) Standalone reports (Web Parts).
(ii) Fully functioning reports. - Excel file – a standard Excel-based application.
Via Excel, out-of-the-box reports can be presented through a connection to the multidimensional model. These reports can be provided via power view or excel pivot reports
- Excel services report – embedded in SharePoint.
- Cloud Solution – Microsoft Power BI with Cloud-based database. Reports and dashboards can be created on the Microsoft Cloud Power BI solution
- Hybrid Solution – Microsoft cloud Power BI with On-premises database. Reports and dashboards can be created on the Microsoft Cloud Power BI solution, while data remains on-premise.